The Why, How, and What of Metrics and Observability
By Sneha Inguva
- Published:
- 7 min read
If you are reading this post, you are probably aware that DigitalOcean is an infrastructure company. (And if you weren’t aware of that: surprise!) As a cloud platform provider, we have a varied tech stack ranging from the many services that power the cloud, from hardware to virtualization software, and even container orchestration tooling. But with many moving pieces comes a vital need: that of observability. Observability is often defined as consisting of three “pillars”: logging, metrics, and tracing. In this post, however, I will focus on metrics, namely how we at DigitalOcean have leveraged Prometheus and Alertmanager for whitebox monitoring both our services and our container clusters. Whether you are a software engineer writing services or an operations engineer maintaining a container orchestration solution, these monitoring and alerting examples should prove useful.
More to Monitoring Than “Knowing When Things Break”
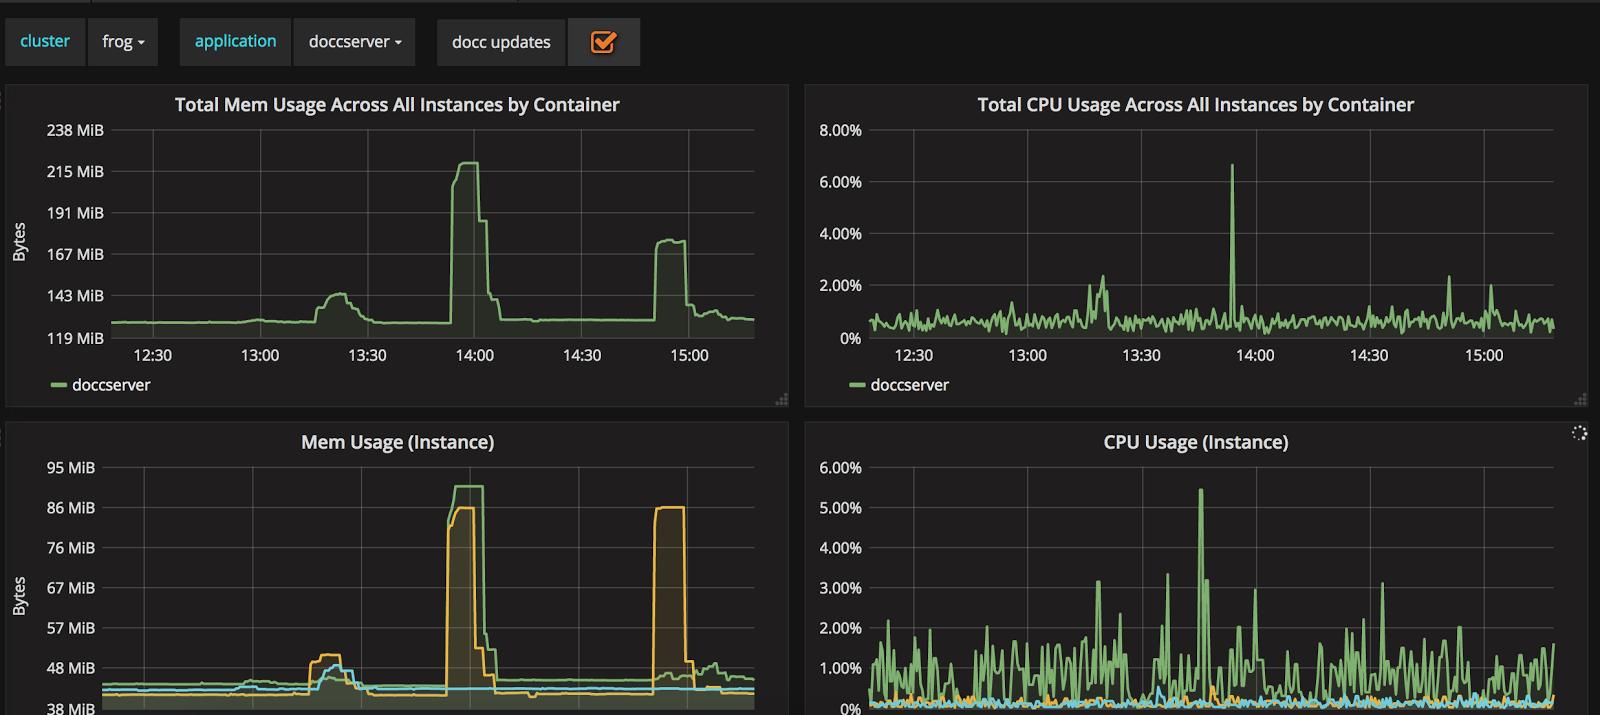
Before delving into the what and how of monitoring, however, I’ll first focus on the why: specifically, why you—an engineer—should monitor your applications or infrastructure stack. The immediate answer might be “to know when things break”, and naturally, alerting upon downtime or other metrics issues is a vital reason to set up monitoring. In fact, most applications at DigitalOcean have either a whitebox monitoring or blackbox monitoring setup and some basic downtime alerts (sometimes, we have both). But beyond just alerting, proper monitoring allows one to identify long-term trends, analyze performance issues, and set up visualizations. For example, every containerized application deployed on our Kubernetes clusters at DigitalOcean has an automatic dashboard generated with basic stats such as memory and CPU usage as well as traffic. Our clusters themselves also have dashboards. These are essential in visualizing general trends and for debugging during on call rotations:
Fig. 1: doccserver application dashboard
I also mentioned that we currently use Prometheus and Alertmanager for both monitoring and alerting: our hows of monitoring. The journey towards using this tooling is also quite interesting and one that I’ve had the opportunity to bear witness to. DigitalOcean originally leveraged Chef and a hodgepodge of scripts or CI/CD tools for provisioning, updates, and deployments. Nagios was commonly utilized (and still is) to perform blackbox monitoring on hosts. This, however, was not enough. While blackbox monitoring is one piece of the puzzle, it doesn’t provide sufficient introspection into applications or truly help with debugging a variety of issues. As a result, engineers went through a long process of trying out several other solutions, which were always lacking in some element. Some were difficult to set up and operationally maintain while others didn’t provide useful visualizations or UX. Furthermore, actually leveraging the data for analysis proved difficult…but along came Prometheus and Alertmanager.
Four base metrics types are at the core of Prometheus— counters, gauges, summaries, and histograms—which can be combined alongside a powerful query language with various functions for analysis and debugging. Prometheus proved to be extremely easy to install, either via a simple Go binary or Docker container. Furthermore, the fact that the time-series data was multidimensional proved immensely helpful, as our adoption of Prometheus coincided with our move towards containerization; having the ability to label data made analysis and aggregation all the more simple when using tools such as Kubernetes. As a result, Prometheus swiftly became our go-to tool for whitebox monitoring alongside Alertmanager for alerting.
Metrics: Leveraging The Four Golden Signals
We’ve established the why and how of monitoring; let us now look into the what. Two categories of metrics we leverage at DigitalOcean are the four golden signals (of Google SRE-book fame) for our request-based microservices and USE metrics, which we heavily utilize to monitor our container orchestration clusters such as Kubernetes or Mesos.
The four golden signals consist of latency, saturation, traffic, and error. Latency refers to the duration of requests; one important thing to note is that it is vital to consider the distribution of request duration, especially the longtail or 99th percentile. After all, what affects only a few of your users can often be an indication of impending saturation—another golden signal. Saturation itself is defined as the “fullness” of a system; it indicates how long something is waiting to be serviced. As a result, we often carefully track an alert based upon 95th or 99th percentile request latencies:
Fig. 2: Kube-dns 95th percentile request latency in ms
Note that generating these metrics, and subsequently configuring alerts, is fairly easy using the Prometheus histogram metric type:
histogram_quantile(0.95, sum(rate(kubedns_probe_kubedns_latency_ms_bucket[1m])) BY (le, kubernetes_pod_name)) > 1000
As histogram metrics are collected as counts in various buckets, we merely need to specify which percentile measurement we would like to calculate and leverage the histogram_quantile function. It is also possible to calculate latency quantiles using the summary metric by specifying the exact quantile we wish to track. While this may reduce quantile estimation error, it is a more expensive client side calculation.
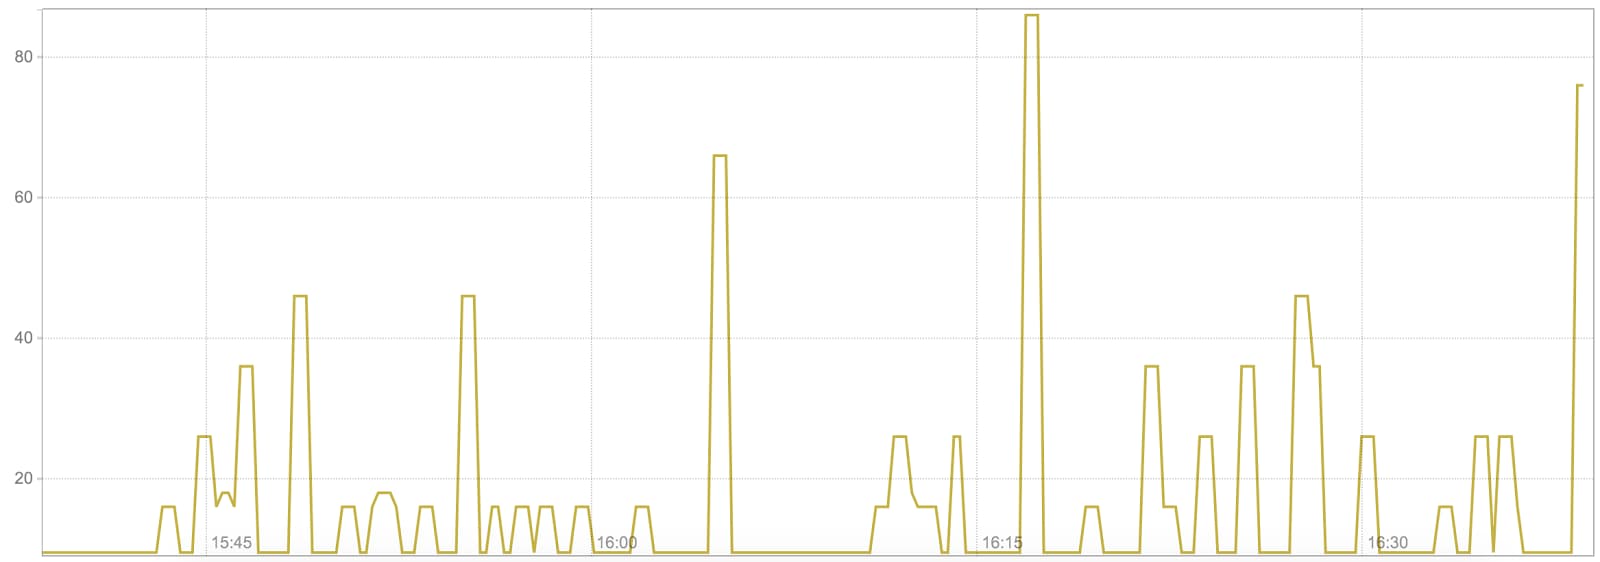
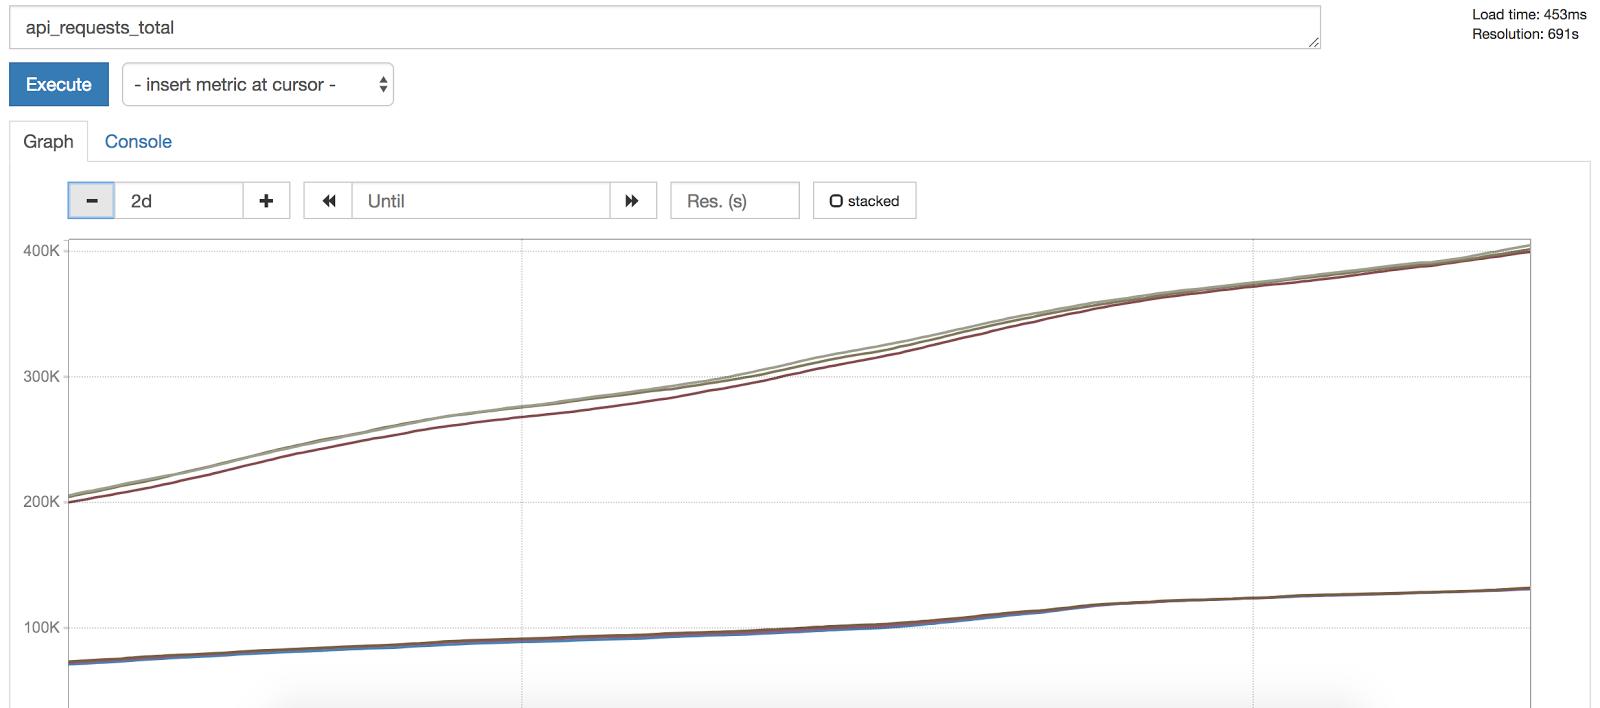
Now onto the final two golden signals! Traffic refers to the amount of demand placed on your system. In a request-based system, this is often measured in HTTP requests per second. In order to measure traffic using Prometheus, we often instrument our applications to expose a request count metric that is monotonically increasing and then calculate the per-second rate. Why? Looking at a constantly increasing counts alone would not provide any indication of abnormal traffic increases or decreases:
Fig. 3: Note that request count constantly increases.
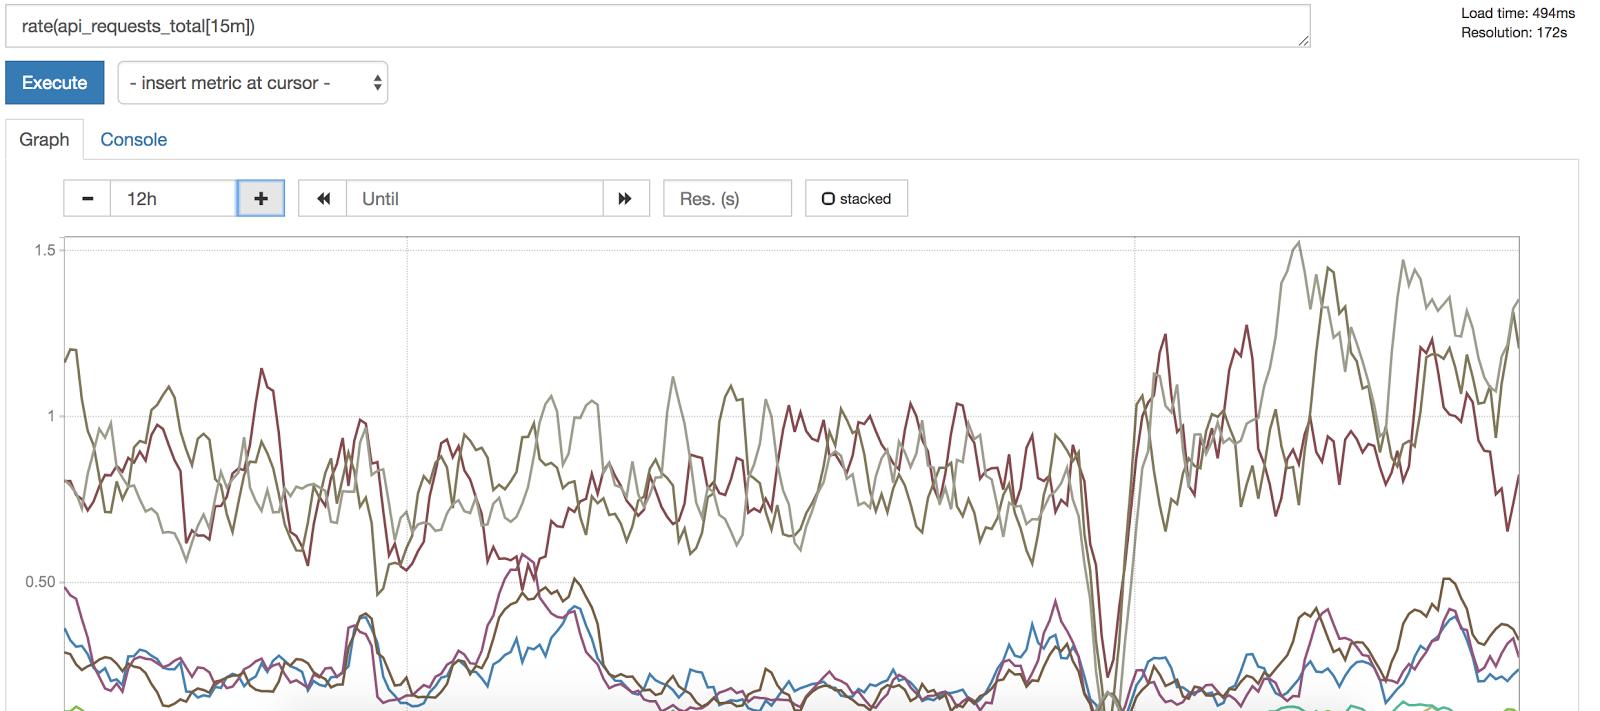
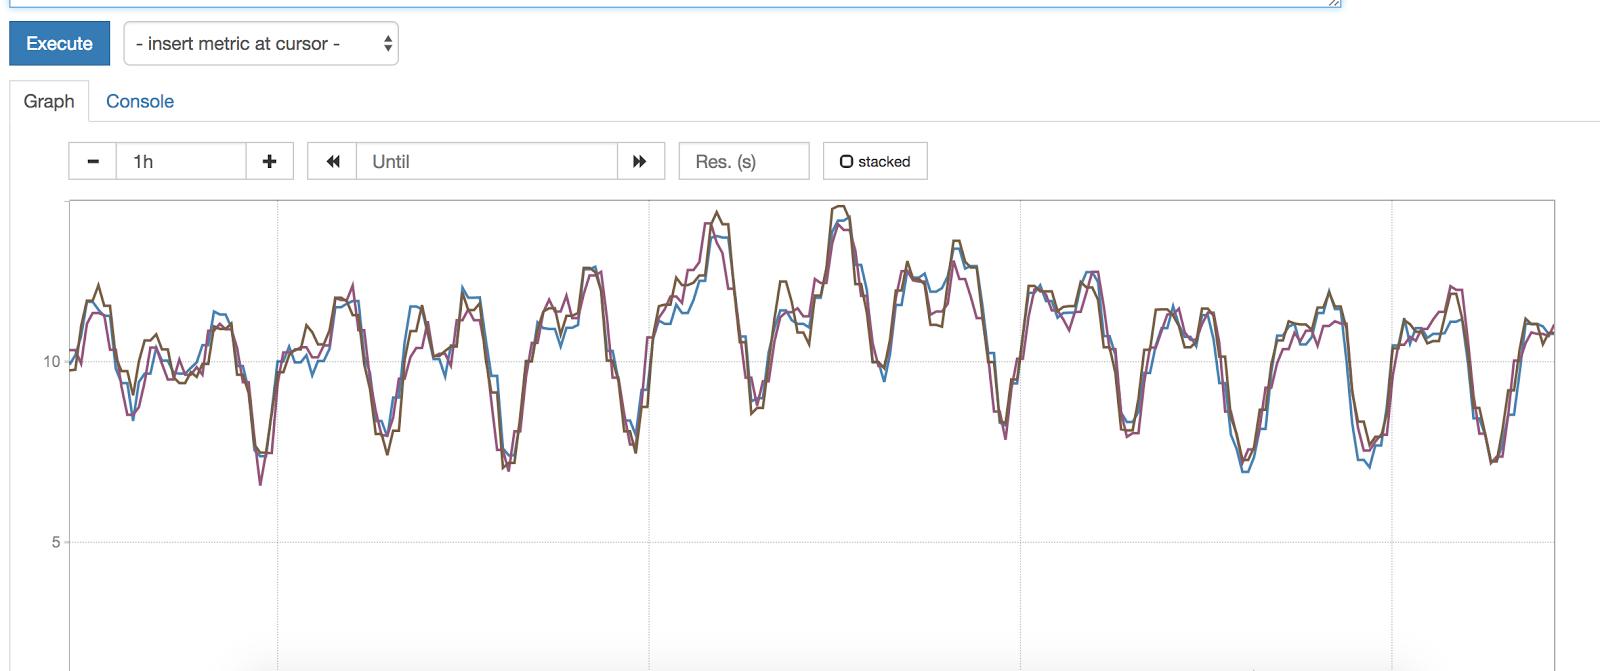
However, looking at rate of requests gives us a meaningful idea of traffic; we can then subsequently set up alerts for per-second rate exceeding above or dropping below a particular value:
Fig. 4: By applying rate() over a 15 minute window, we get a meaningful idea of traffic.
Error rates of failing or succeeding requests—the final golden signal—are calculated similarly. Applications are instrumented to expose error count with labels indicating status code or other information; per-second rate is then calculated to provide a meaningful metric:
Fig. 5: Per-second error rate for cassandra
Note that the per-second rate suddenly spiked but decreased. However, as this was lower than the alert configured below (at 50 errors per-second), no alert was triggered:
sum(rate(cassandra_query_latency_count{docc_app=~“timeseries-ingest-index[0-9]+”,result=“error”}[5m])) > 50
Using these four golden signals, we can gain a basic idea of both the health of our request-based services as well as an idea of our end user’s experiences. We can both visualize these metrics on a dashboard and also set up alerts for any abnormal metrics.
In addition to monitoring our services, we also monitor our infrastructure. As a former member of the team that maintained our container clusters, I noticed enormous benefits when leveraging the USE method: utilization, saturation, and errors. Coined by Brendan Gregg, the USE method allows one to solve “80% of server issues with 5% of the effort”.
Let us take a look at how we leveraged these metrics to monitor our Kubernetes clusters. Each cluster consists of multiple worker nodes known as kubelets. Monitoring overall CPU, memory utilization, and reservation on these nodes has proven essential:
Fig. 6: Kubernetes worker node CPU utilization for a single worker node
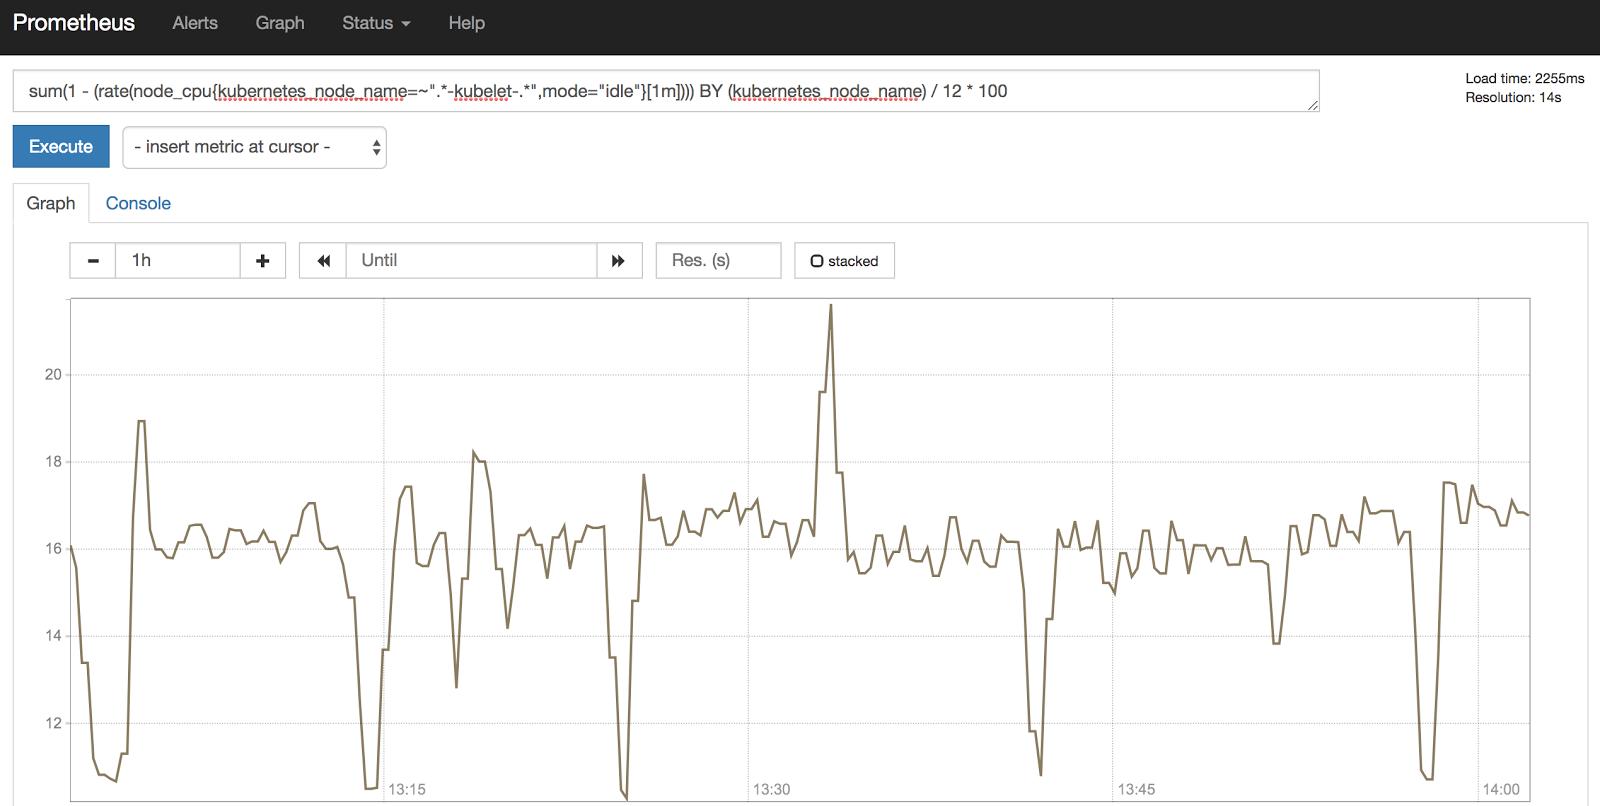
Note that CPU utilization is measured in CPU seconds, a constantly increasing counter. As a result, calculating the per-second rate of CPU seconds gives us the number of CPU cores being utilized at a given time. We can further tweak this calculation to craft an alert to detect greater than a given percentage of CPU utilization on a worker node. (If interested in how exactly to do this, be sure to check out this blog post.)
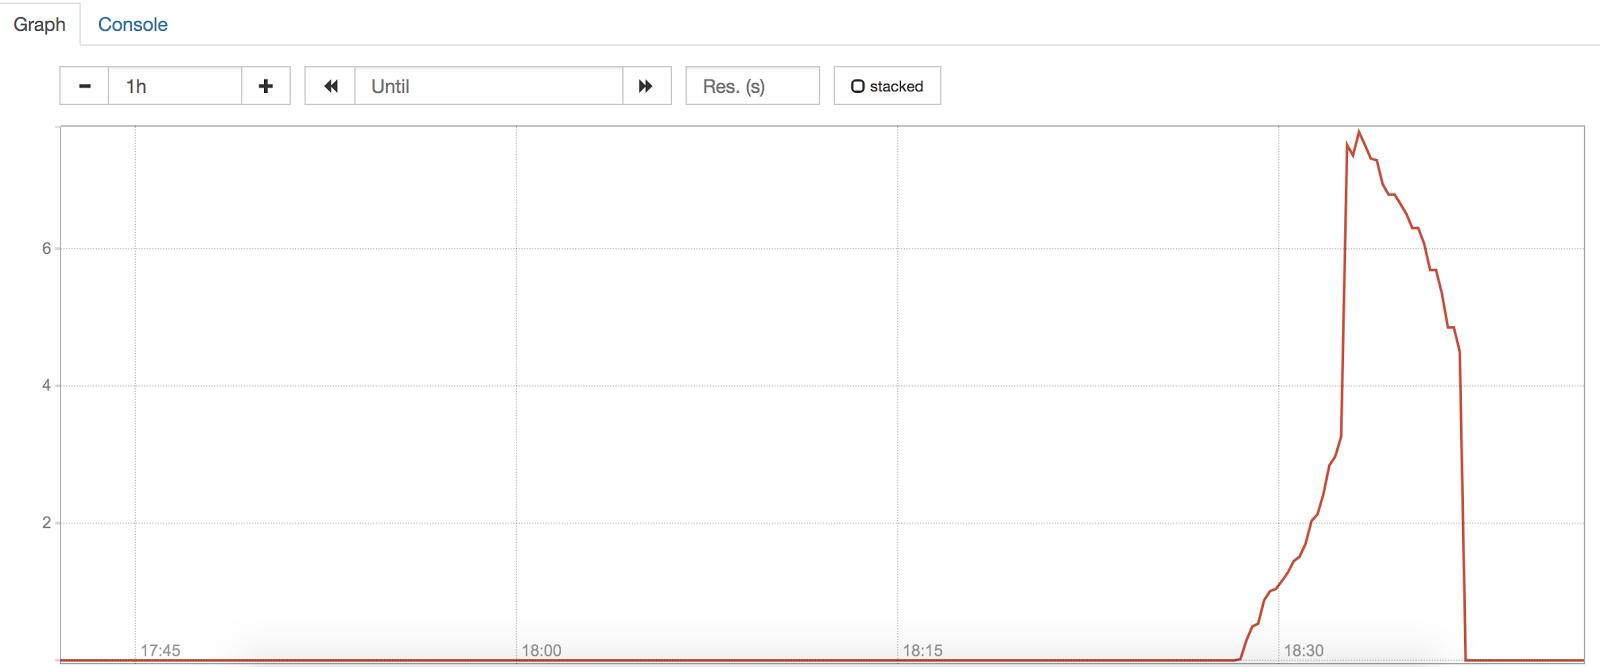
Another key component of our Kubernetes architecture is our HAProxy ingress load balancers; these are components in our network stack and direct much of outside traffic to appropriate services within the cluster. As you can imagine, load balancer connection utilization and saturation are therefore vital to measure:
Fig. 7: Ingress load balancer connection utilization as a %
If all connections are utilized to an ingress load balancer, no additional connections can be made until some are dropped. As a result, we also elect to alert for greater than 50% load balancer connection utilization:
max(haproxy_frontend_current_sessions / haproxy_frontend_limit_sessions) BY (kubernetes_node_name, frontend) * 100 > 50
Conclusion
And there you have it— a small slice of our monitoring and alerting setup at DigitalOcean! With these few examples, hopefully you can see how and why we have elected to leverage the four golden signals and the USE method to monitor and alert on our microservices and container clusters. Doing so has allowed both ops teams and service owners to maintain observability of running applications and key infrastructure. We have also leveraged this data to track long-term trends and look into improving performance. Hopefully you can do the same!
Sources:
[1] Logs and Metrics, Cindy Sridharan. https://medium.com/@copyconstruct/logs-and-metrics-6d34d3026e38
[2] Chapter 6: Monitoring Distributed Systems. Site Reliability Engineering at Google. https://landing.google.com/sre/book/index.html
[3] USE Method. Brendan Gregg. http://www.brendangregg.com/usemethod.html
[4] An Appropriate Use of Metrics. Martin Fowler. https://martinfowler.com/articles/useOfMetrics.html
[5] Monitoring and Observability. Cindy Sridharan. https://medium.com/@copyconstruct/monitoring-and-observability-8417d1952e1c
Sneha Inguva is an enthusiastic software engineer working on building developer tooling at DigitalOcean. Previously, Sneha worked at a number of startups. Her experience across an eclectic range of verticals, from education to 3D printing to casinos, has given her a unique perspective on building and deploying software. When she isn’t bashing away on a project or reading about the latest emerging technology, Sneha is busy molding the minds of young STEM enthusiasts in local NYC schools.
About the author
Related Articles

The Inference Alpha: Maximizing Frontier Models on AMD
Balaji Varadarajan
- June 10, 2026
- 12 min read

The Inference Tax: How Prefix-Aware Routing Eliminates the Hidden Cost of LLMs at Scale
- June 1, 2026
- 13 min read

DigitalOcean Serverless Inference: A Deep Dive
- June 1, 2026
- 17 min read