Sr Technical Content Strategist and Team Lead

Introduction
In this tutorial, you will learn how to collect scrapable metrics for a managed PostgreSQL database on DigitalOcean using a web application deployed on the DigitalOcean App Platform.
You will use a sample Node.js application for this demonstration and connect it to the Managed DigitalOcean PostgreSQL database which you will create in this tutorial.
By the end of this tutorial, you will have a Prometheus dashboard that scrapes and displays metrics from a managed PostgreSQL database connected to an App Platform web application.
Prerequisites
Before starting, ensure you have the following prerequisites in place:
- A DigitalOcean account.
- A sample Node.js application deployed on App Platform.
- A Postgres Database deployed and attached to the App Platform app.
- A Personal access token created with read/write(rw) access. You can follow How to Create a Personal Access Token to create one for yourself by following this tutorial.
Step 1 - Setting Up a Managed PostgreSQL Database
Let’s start with creating a PostgreSQL Database.
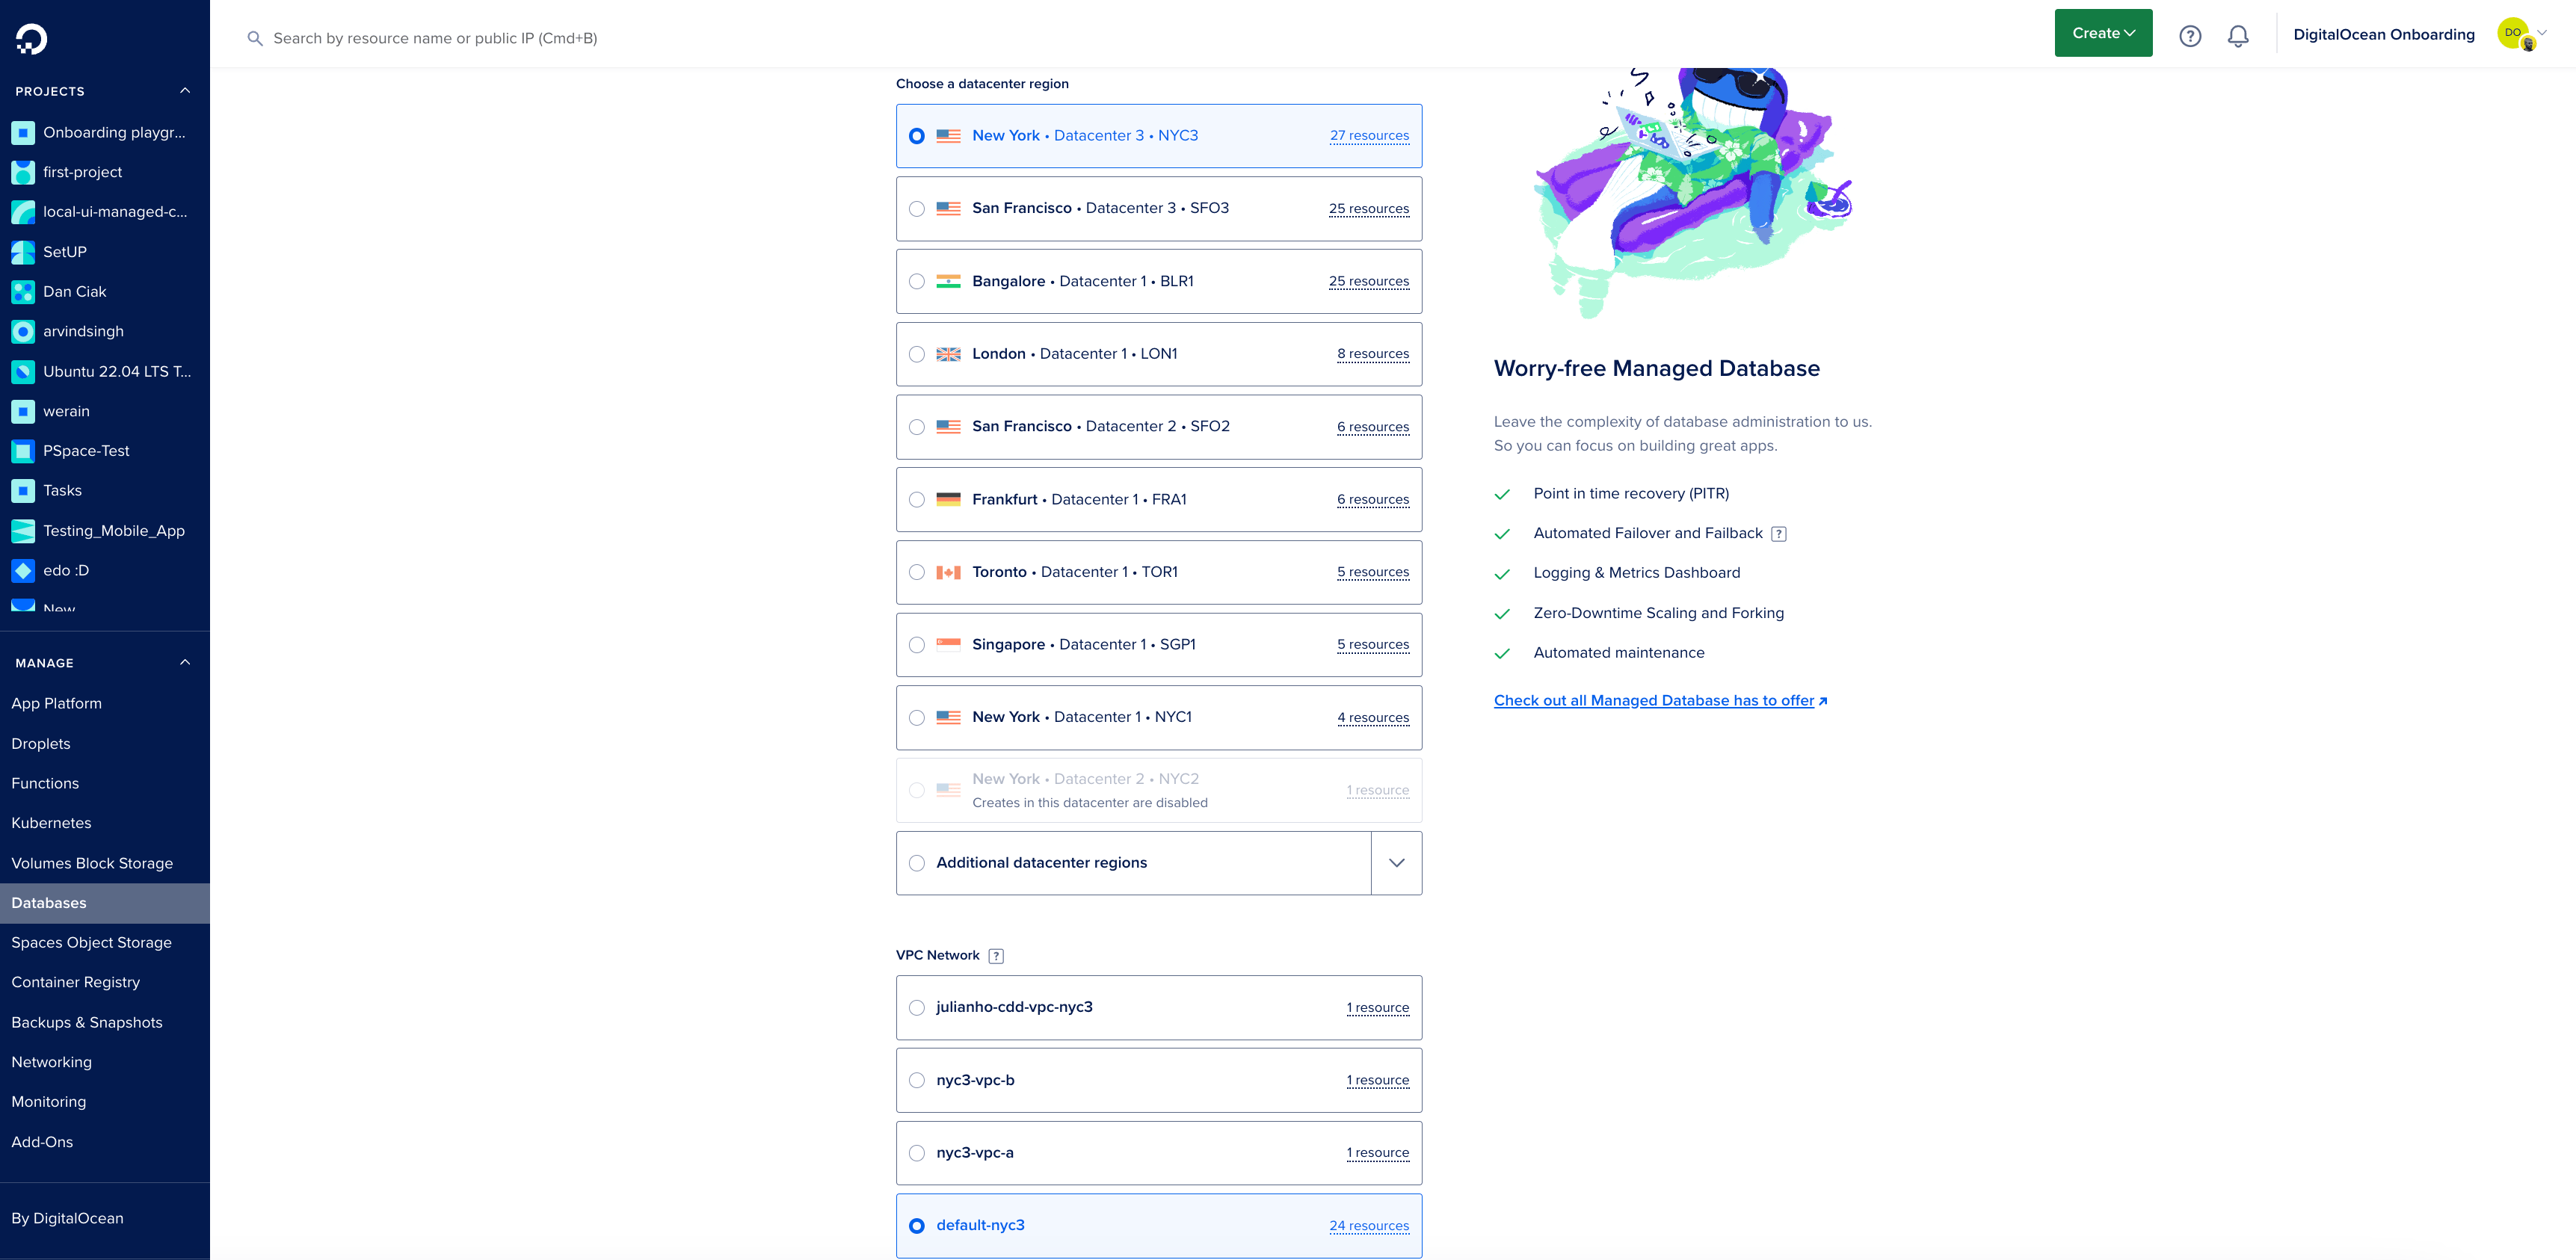
Navigate to the Databases section in your DigitalOcean cloud Control Panel.
Click “Create Database Cluster” and choose PostgreSQL. You will need to choose a data center region and a VPC Network as shown in the screenshot below:
Next, select PostgreSQL as the database and select other settings for your database.
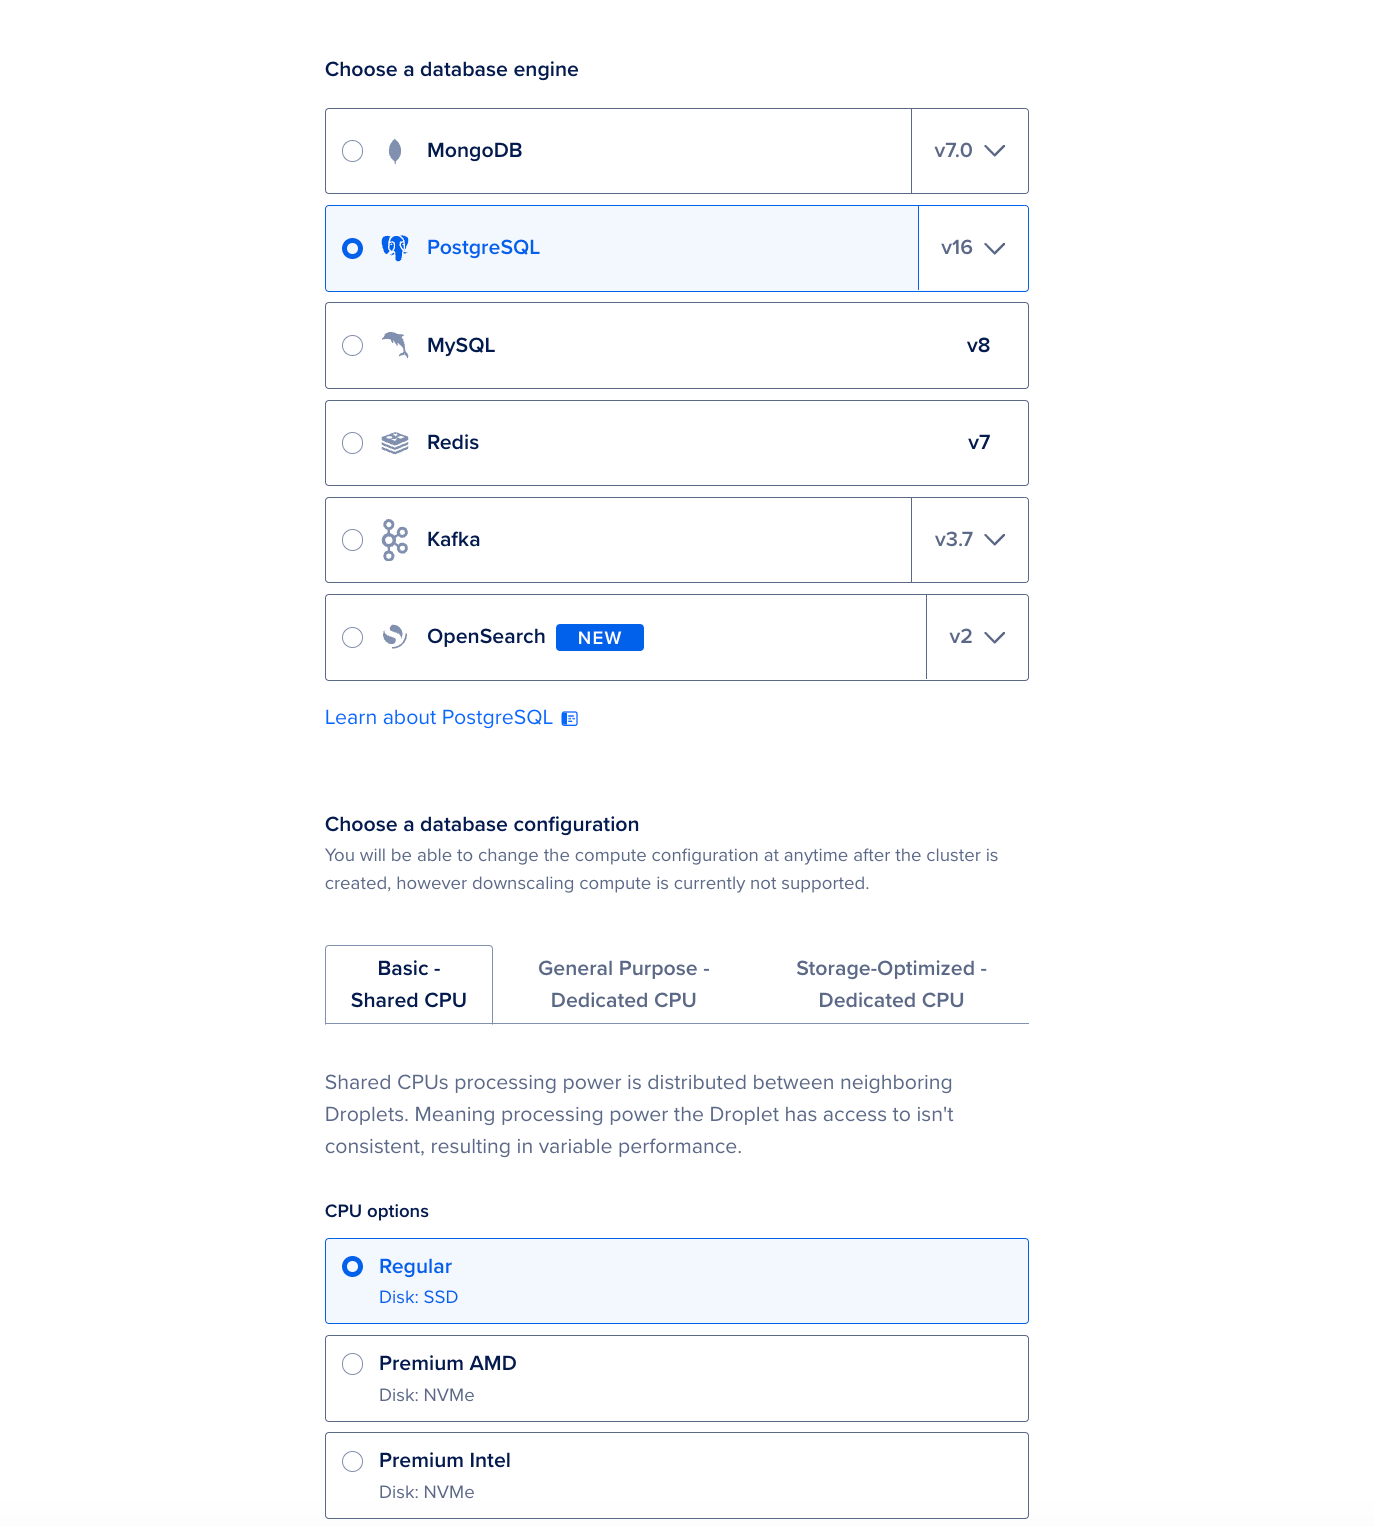
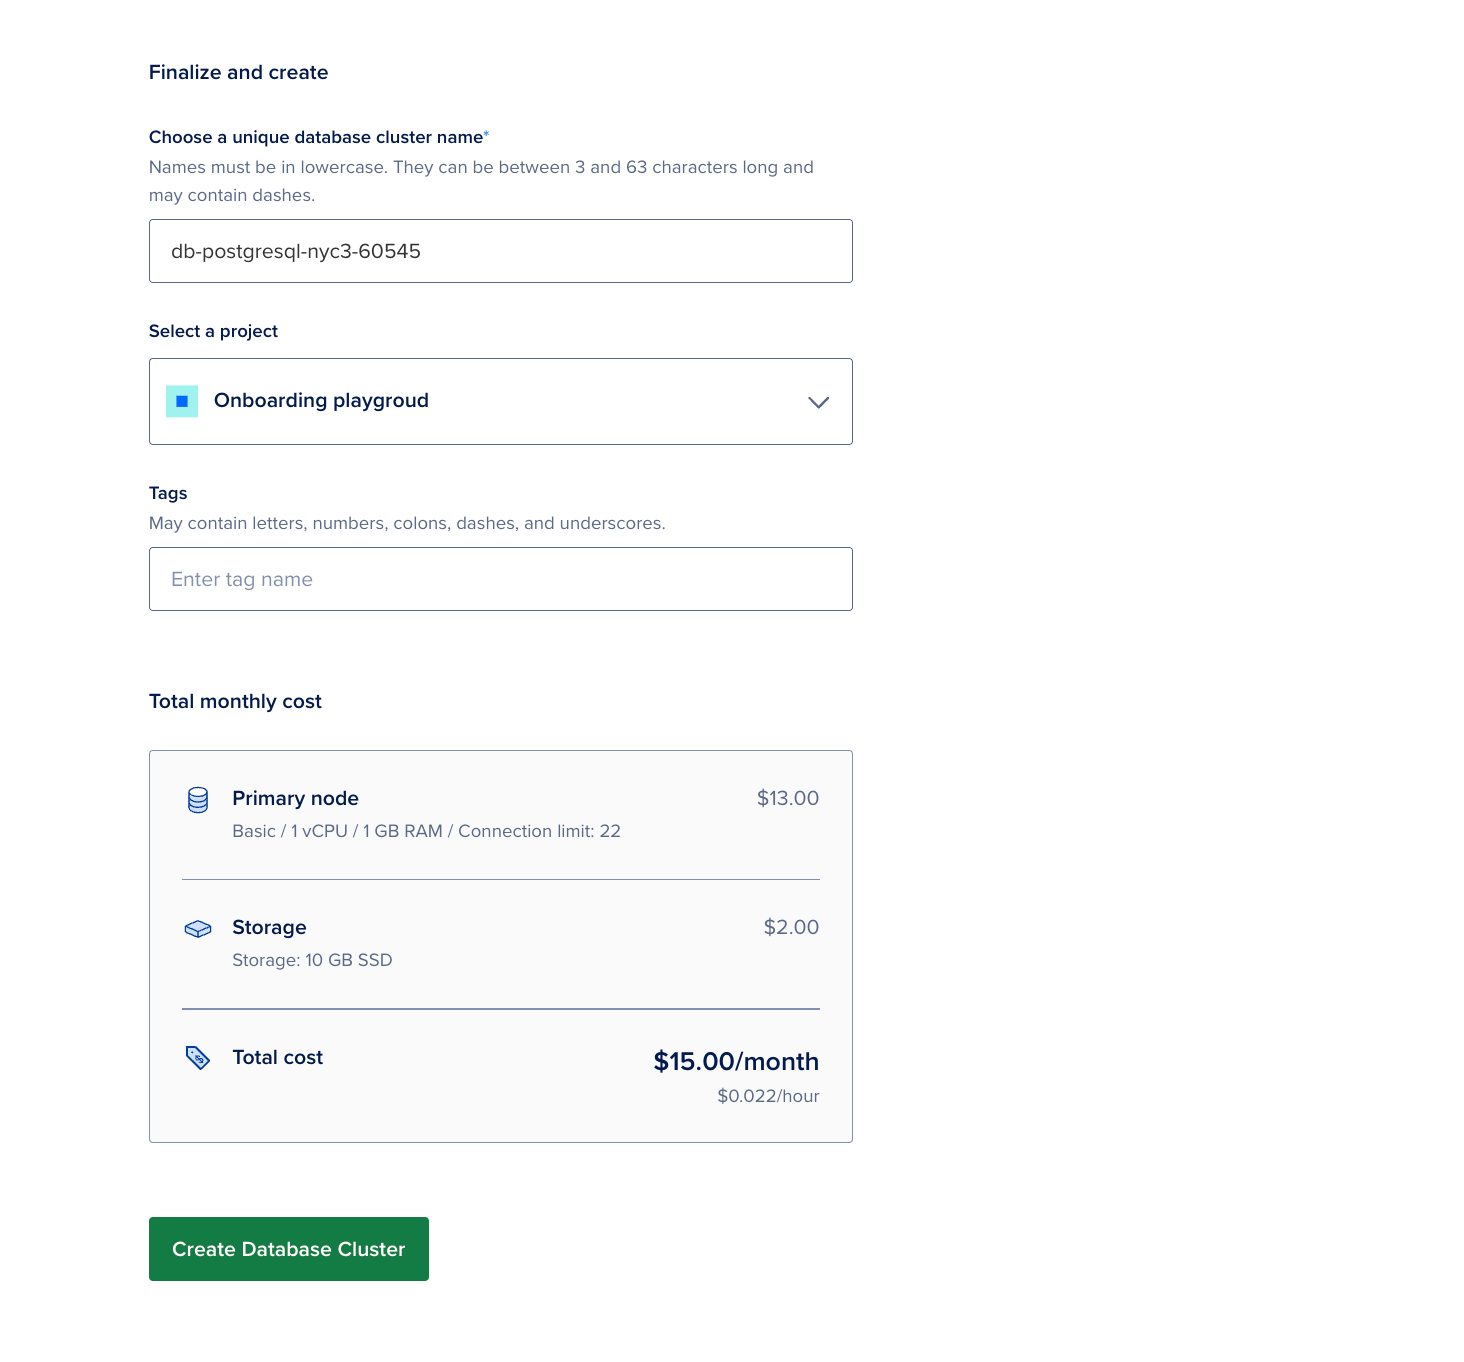
Configure the database settings, follow the on-screen instructions, and click the Create Database cluster.
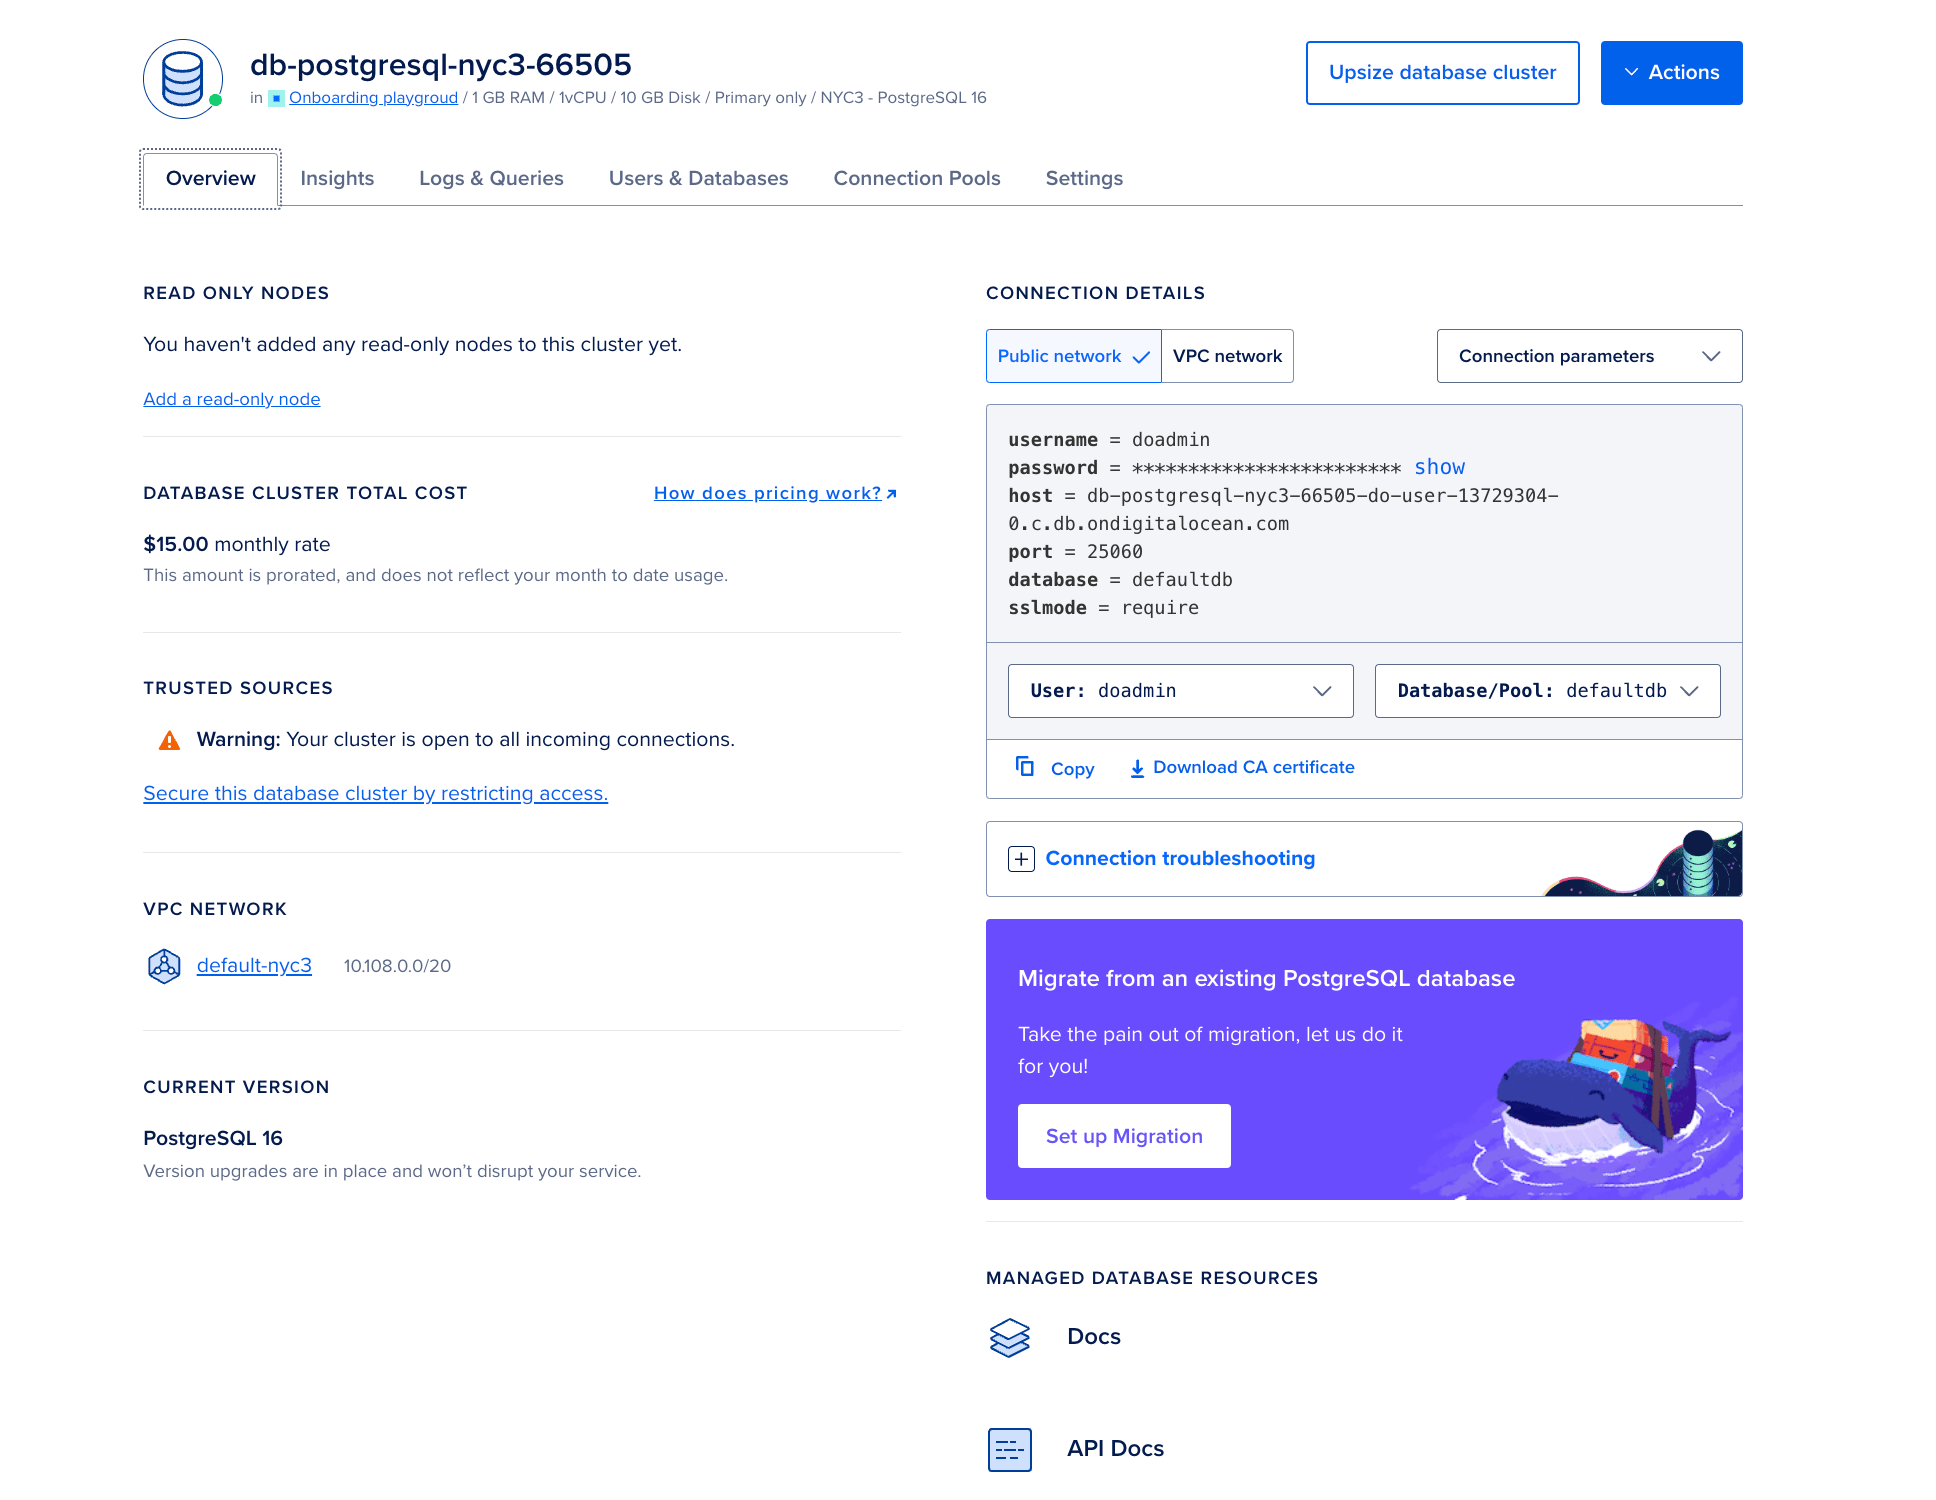
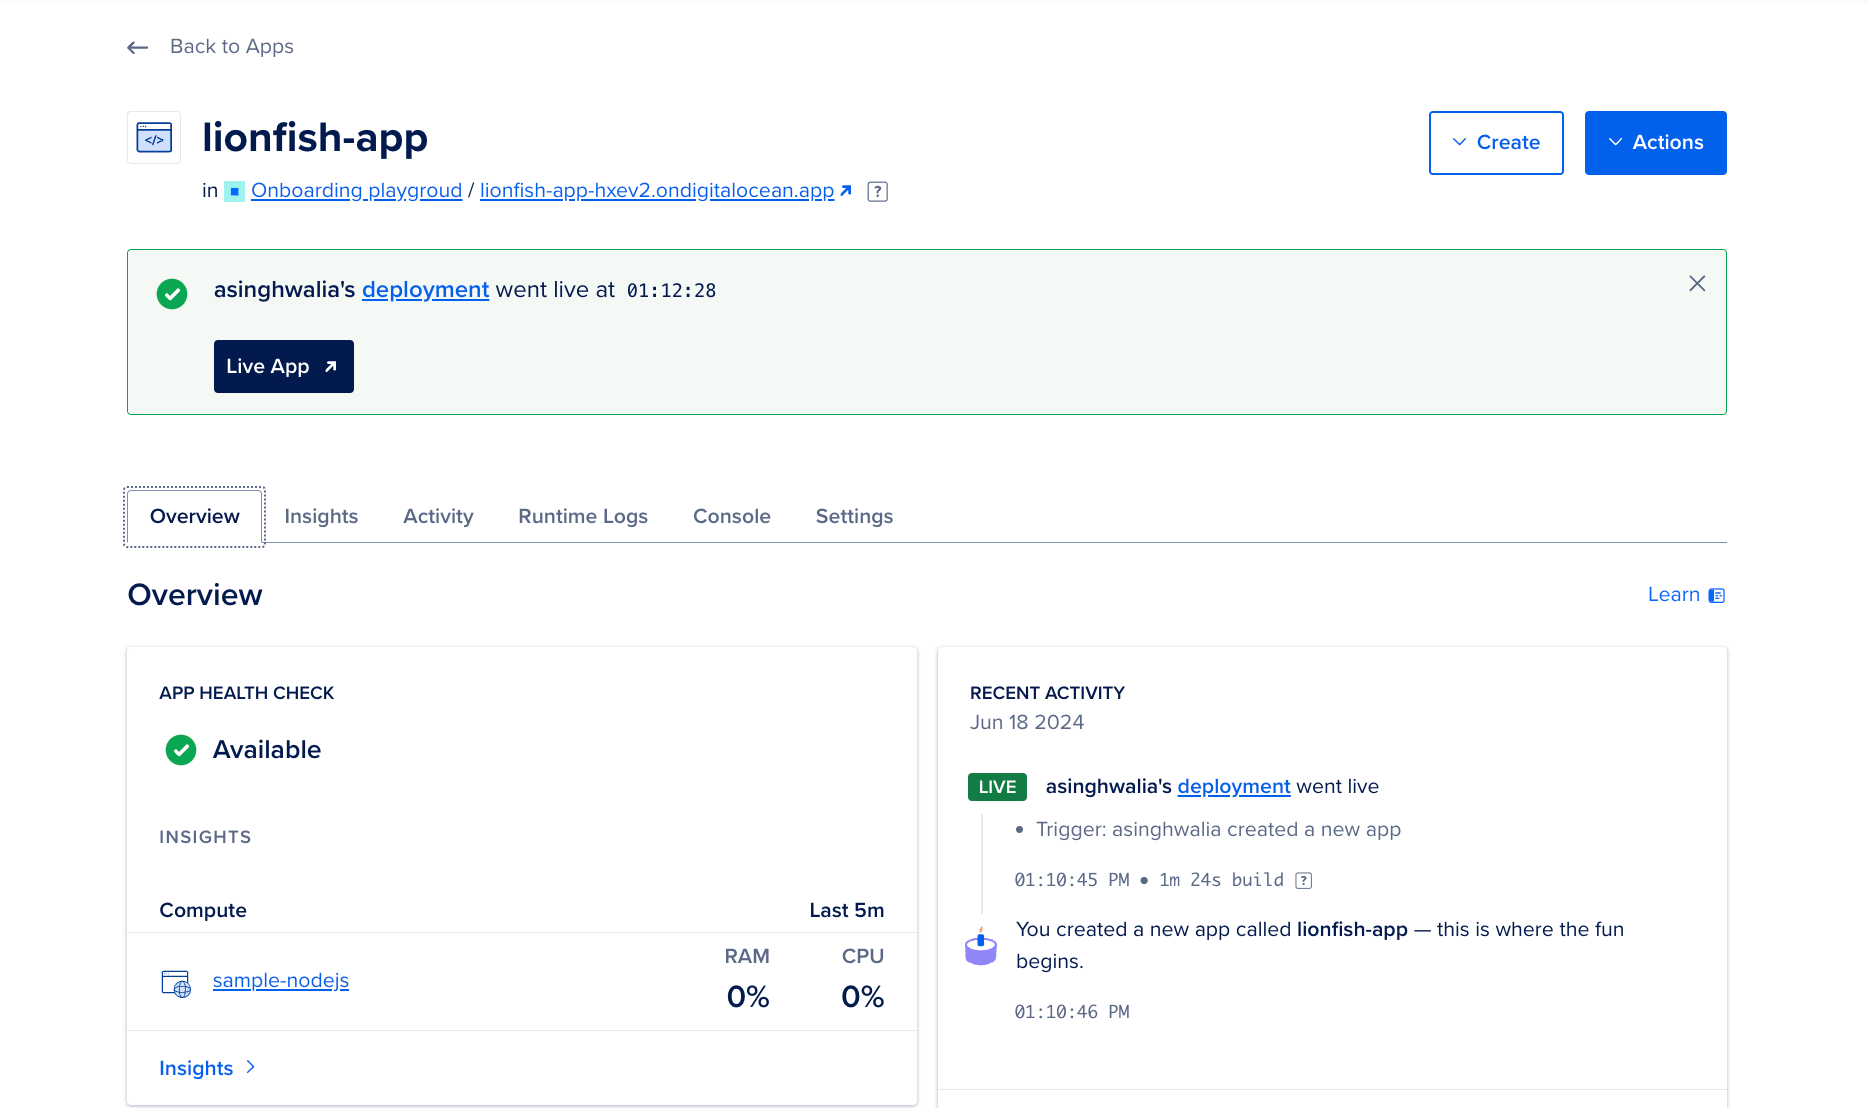
Once the Managed PostgreSQL database cluster is created, you can check its Overview, insights, logs as well as Settings in the below tabs:
Step 2 - Deploying a Sample Node.js Web Application on the App Platform
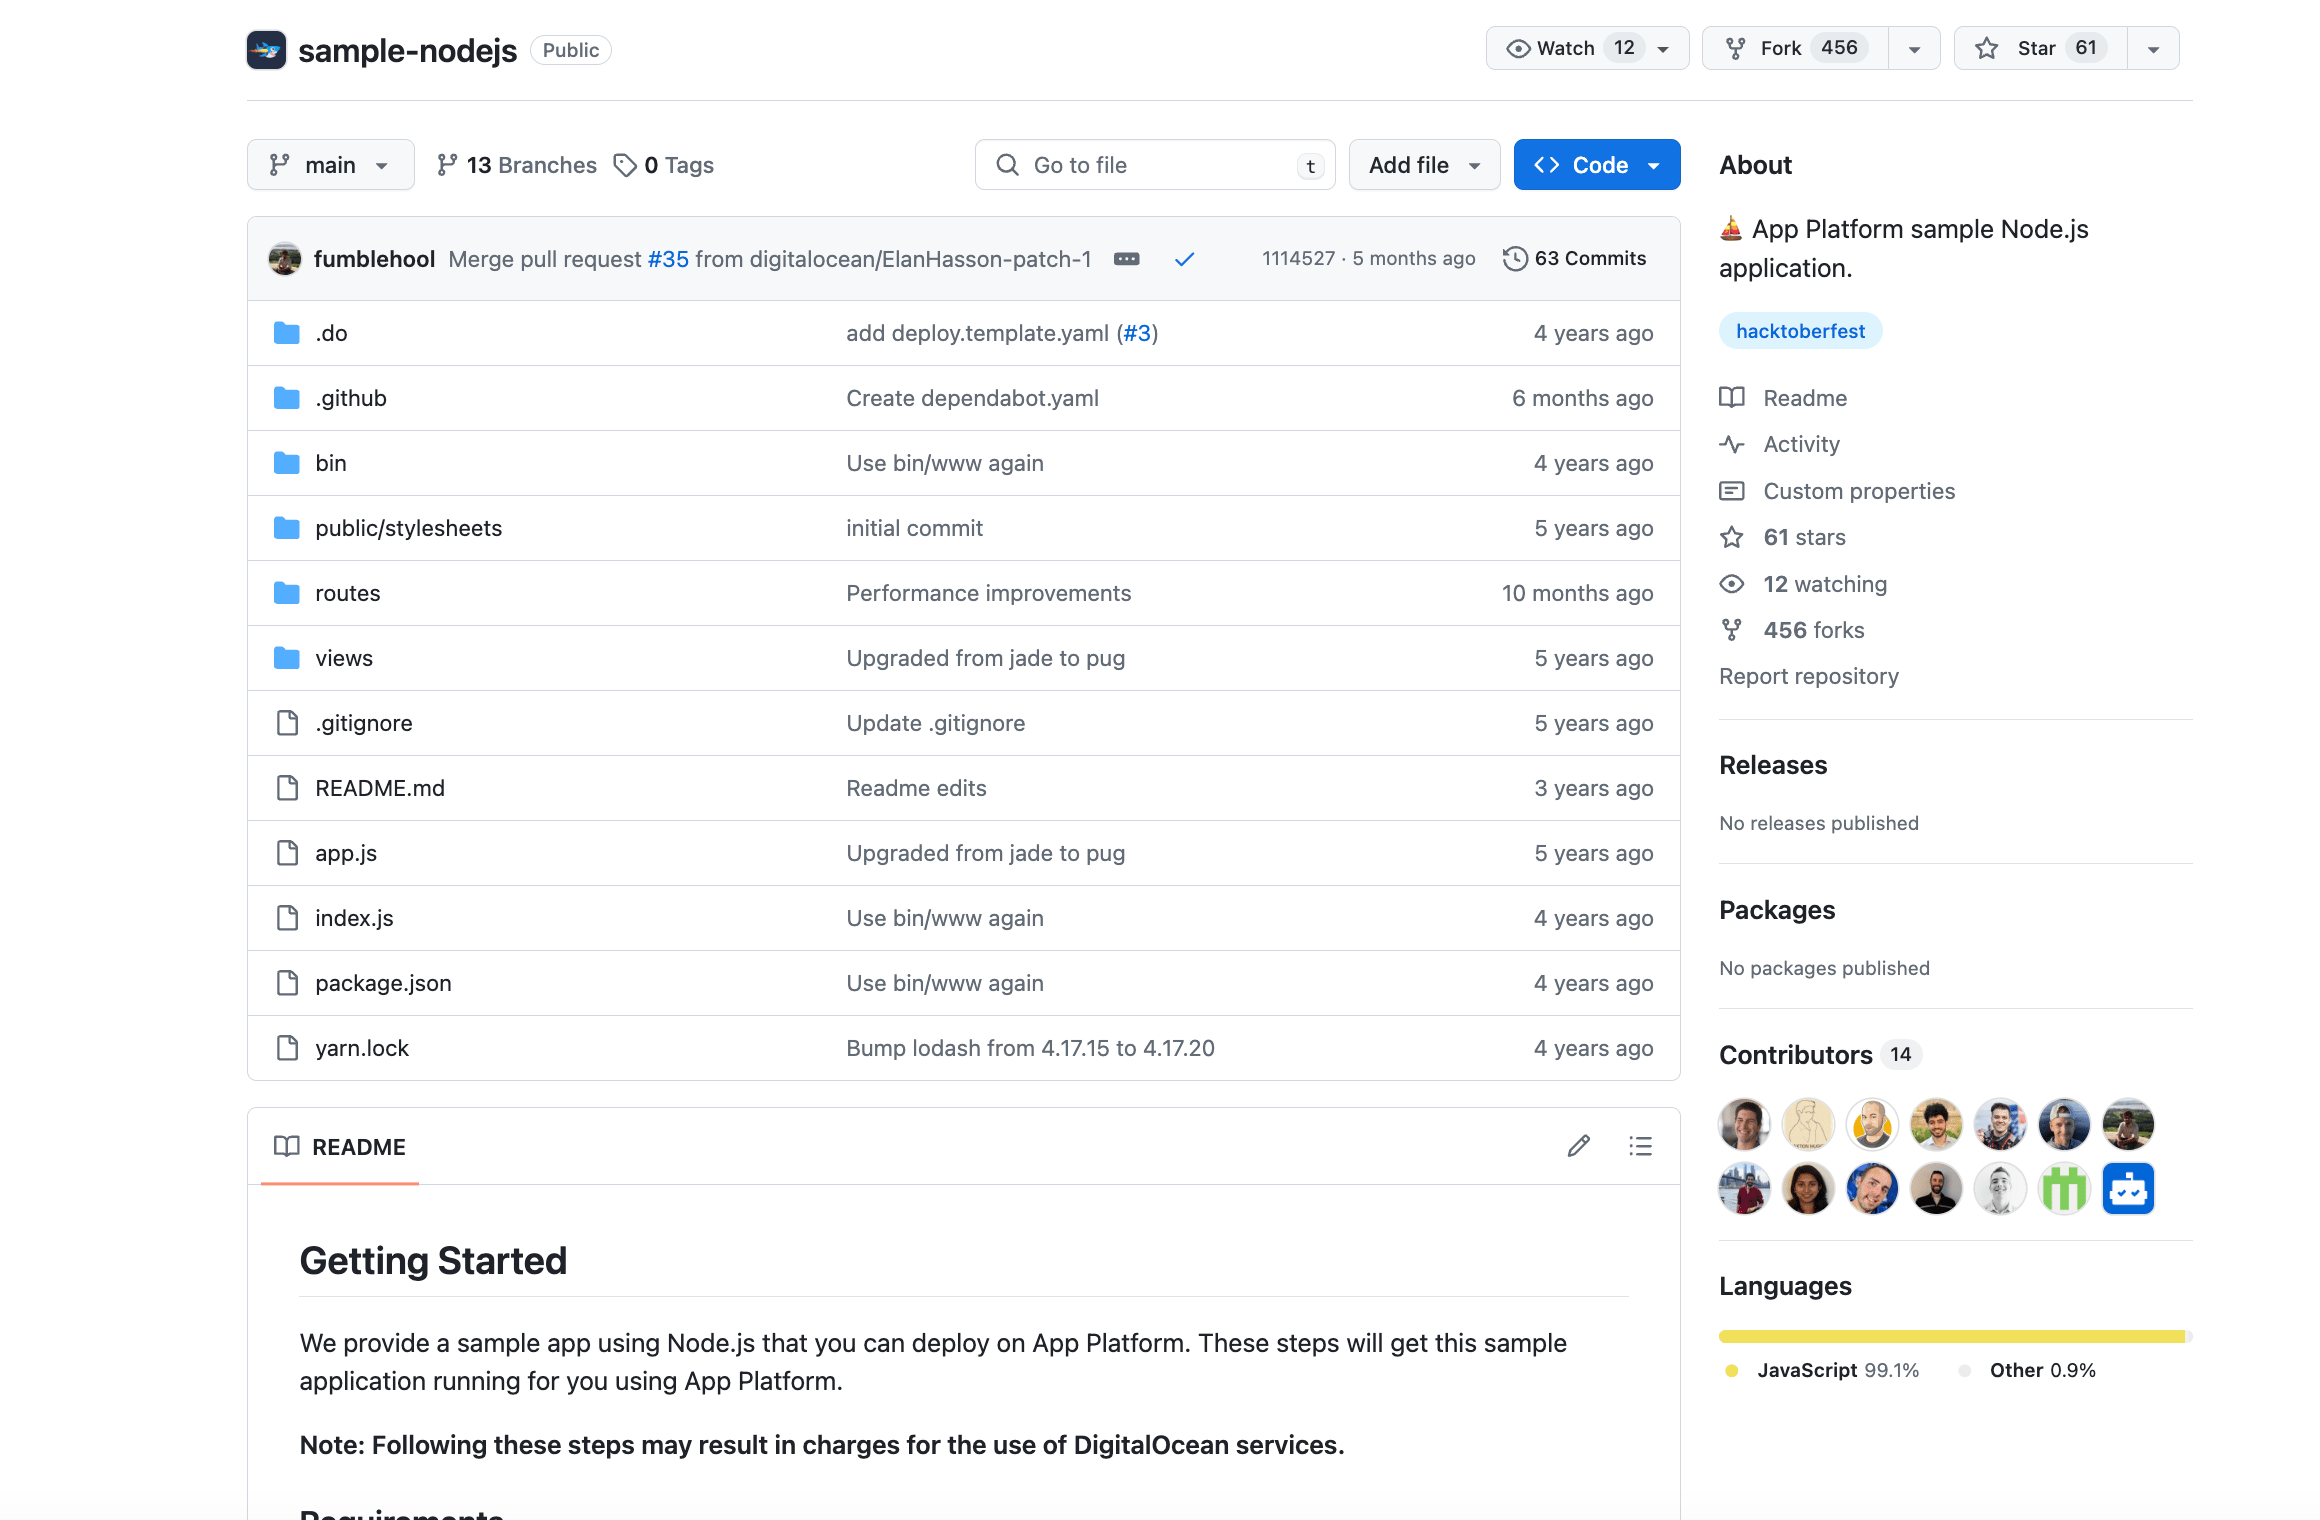
You can either follow the steps to deploy a Sample Node.js application or use this github repo to create an Node.js sample app on App Platform.
If you use the latter, you will need to fork this GitHub repository to your Github account so that you have a copy stored in the cloud. Click the Fork button in the GitHub repository and follow the on-screen instructions.
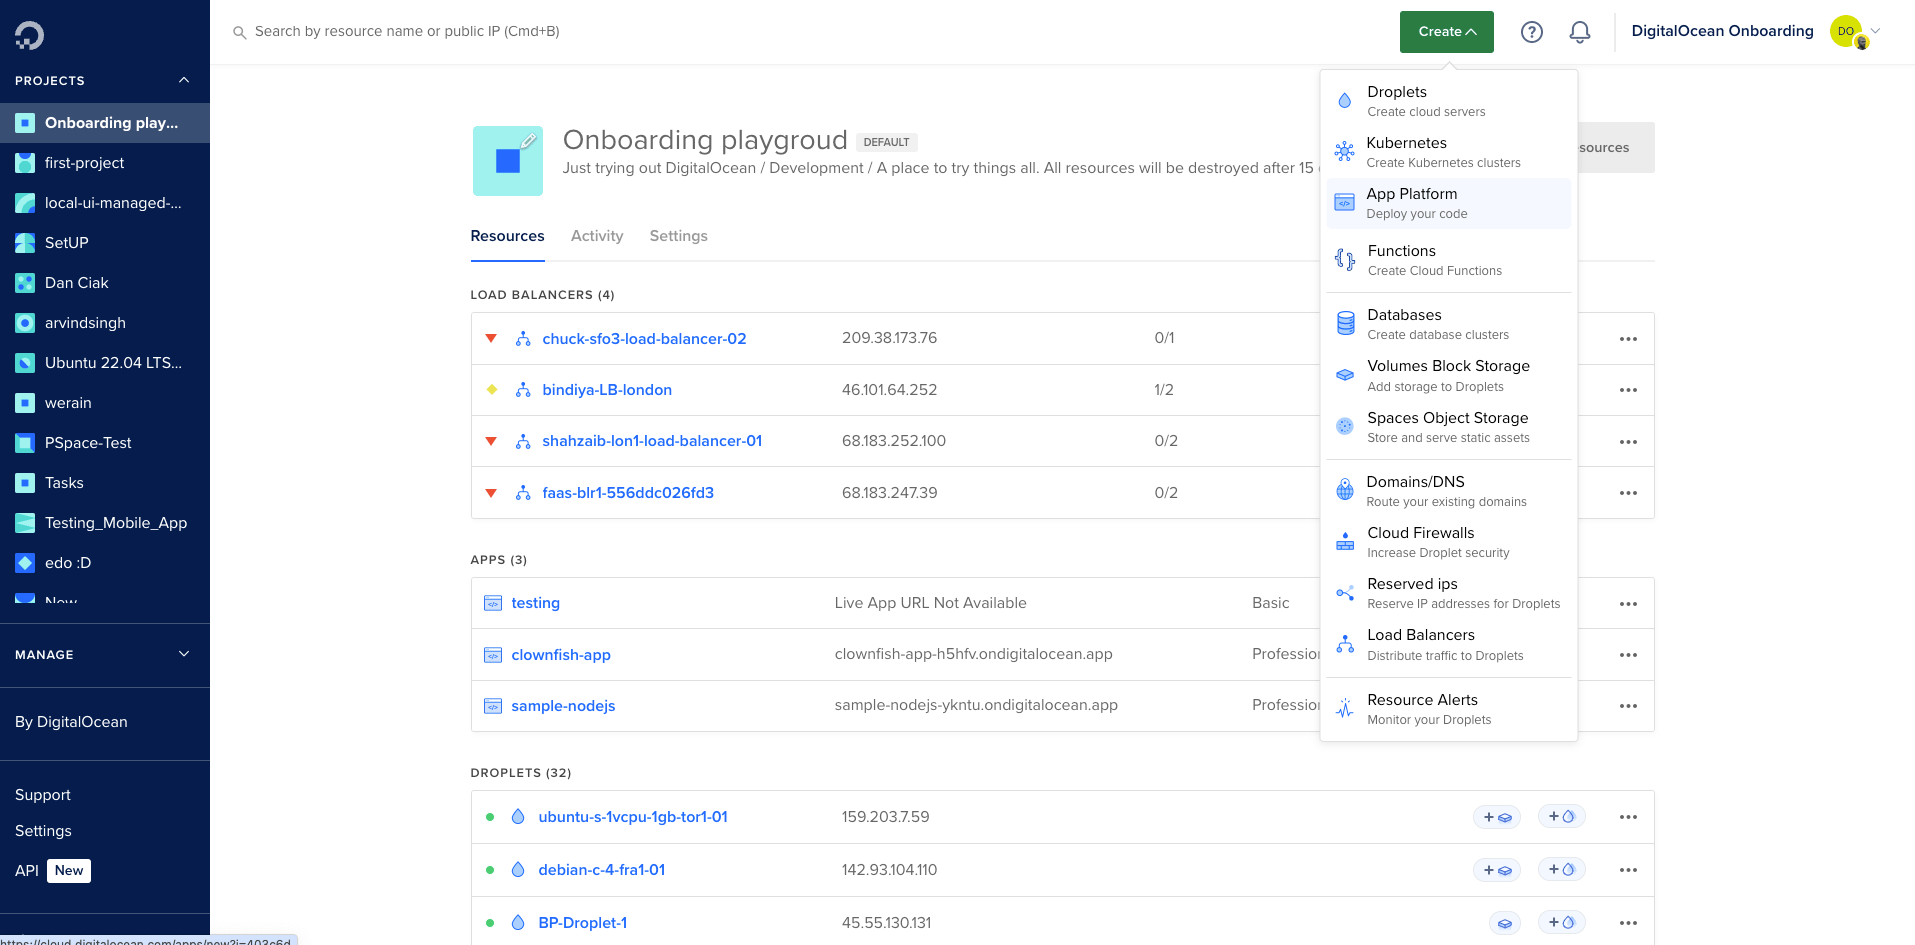
Now login to DigitalOcean cloud portal and navigate to Create App -> App Platform.
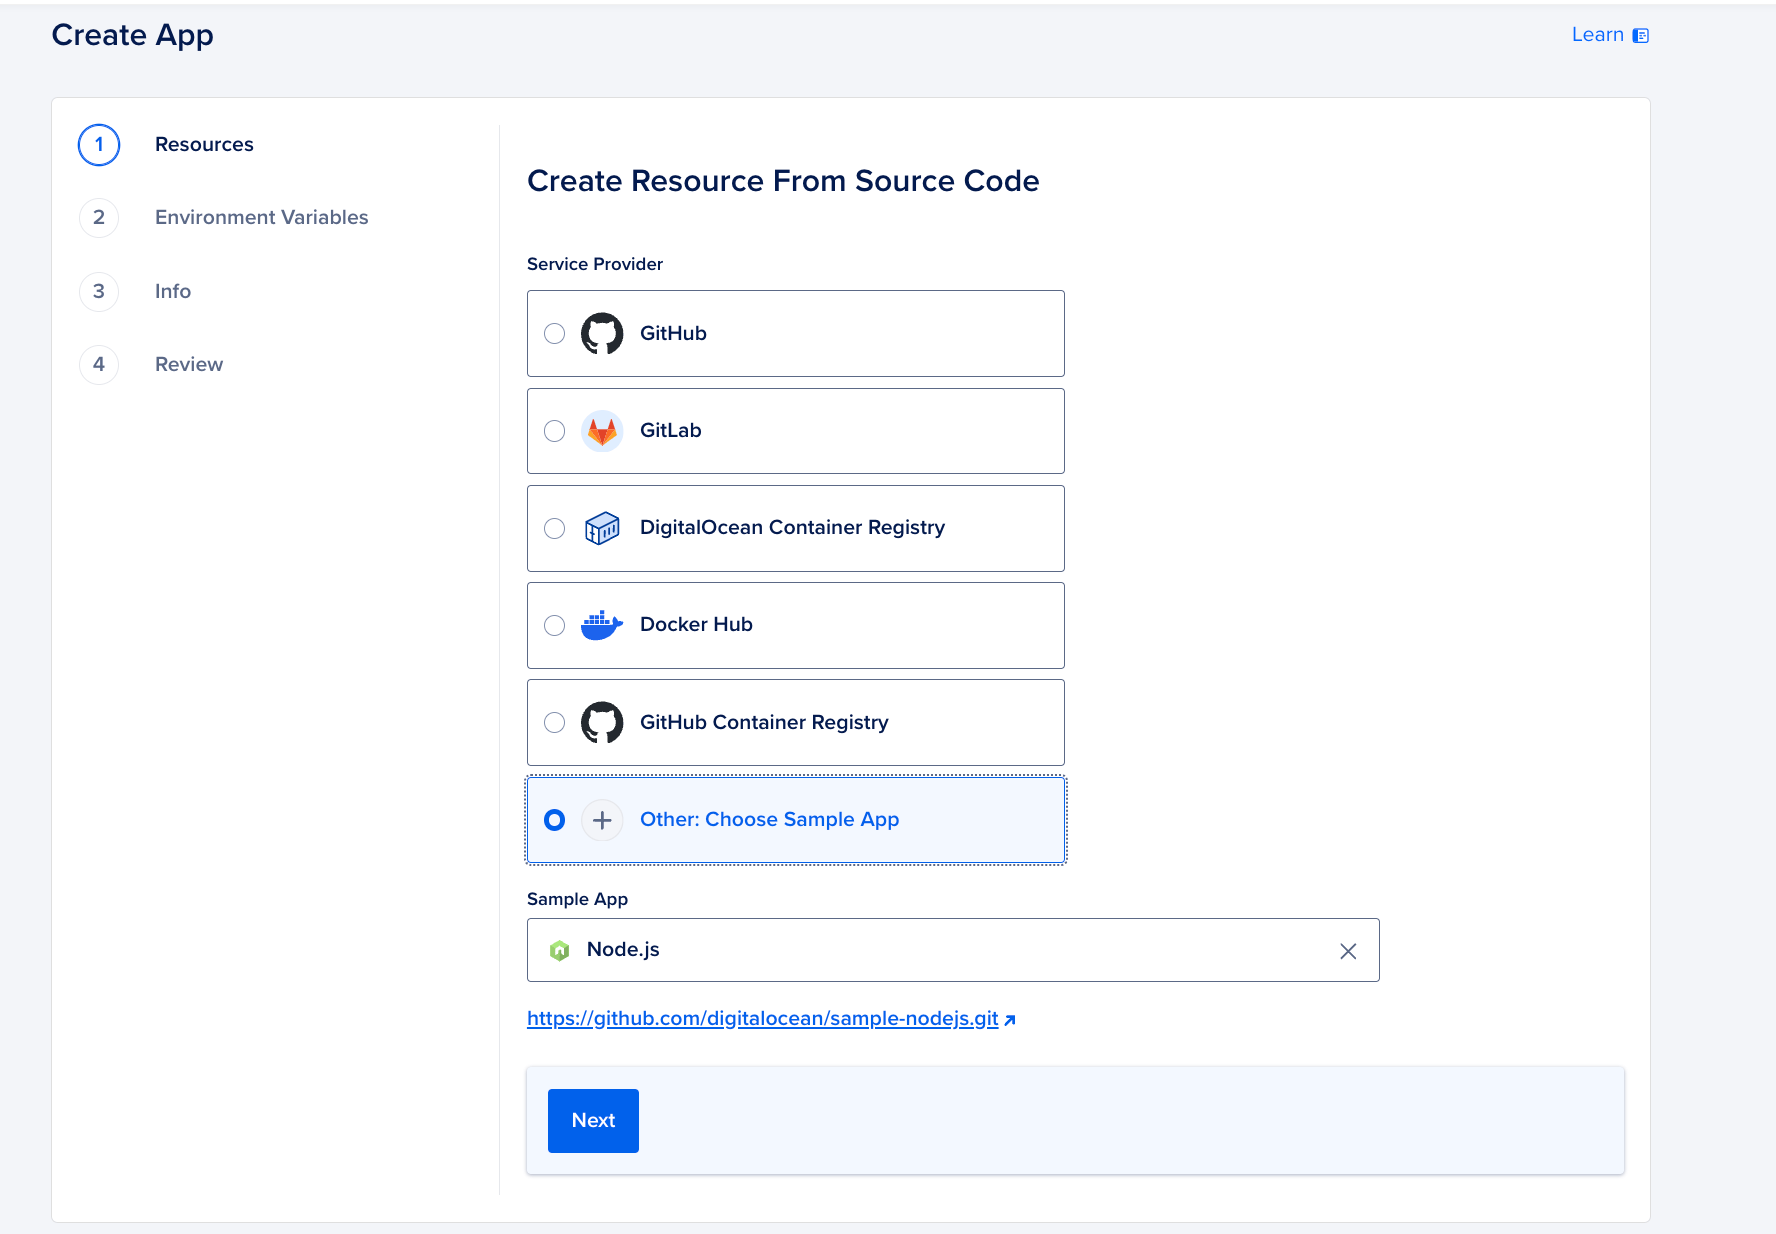
Next, choose “Other: Choose Sample App”, select the Node.js sample app selection from the Sample App dropdown, and click on Next.
Follow the on-screen instructions to set your application’s resources, general configuration, and Environment variables, and click Next. Once done, review the overall configuration of the app. Click on Create Resources when done. Once the application is created, it will take some time to deploy on the App Platform.
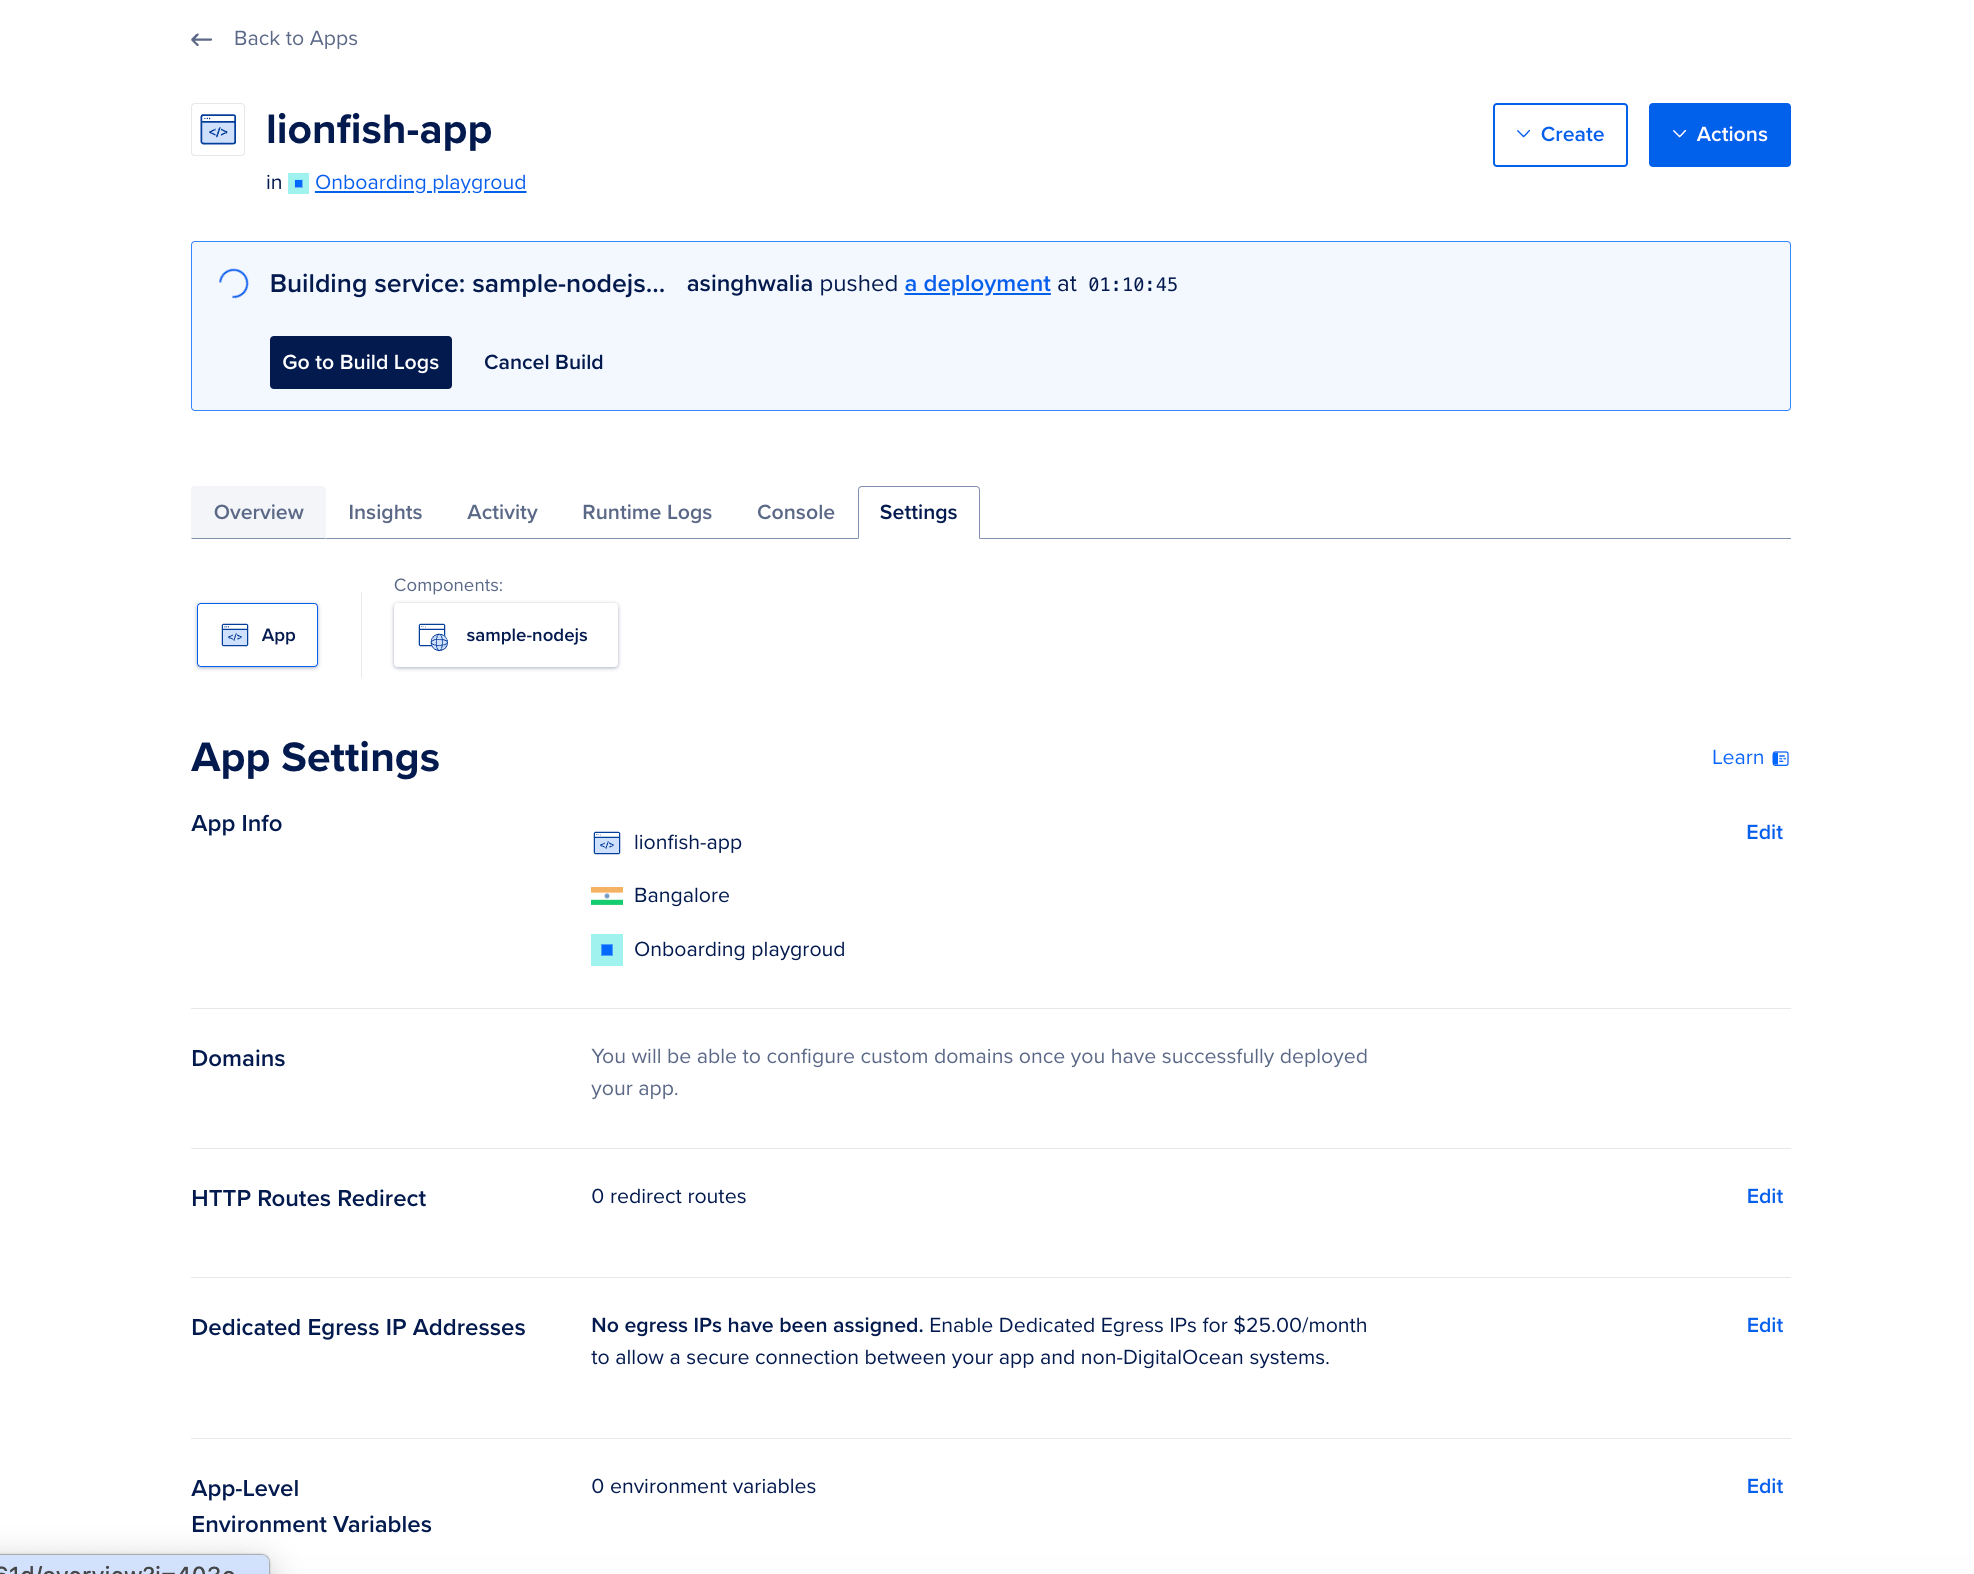
Once the application is deployed and the build is done. You can check the app’s overview and visit the deployed app in your browser.
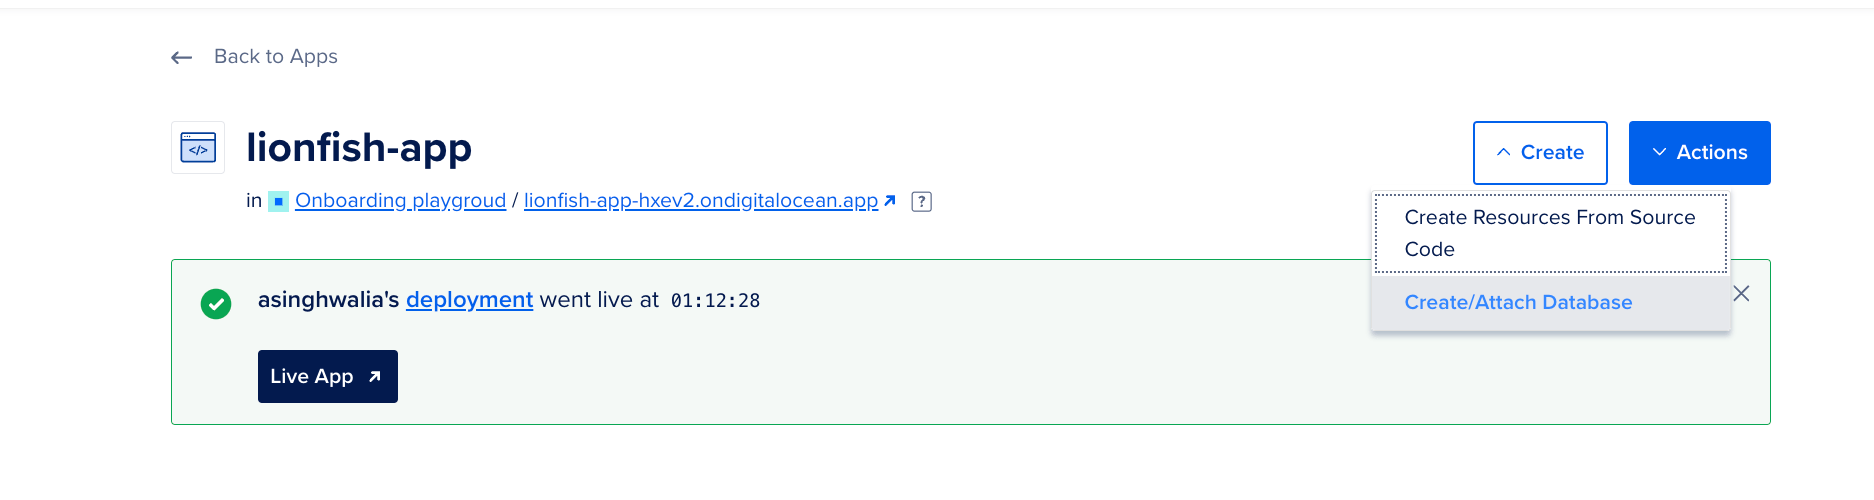
Step 3 - Attach the PostgreSQL Database to the App Platform App
In this step, you will attach the Managed PostgreSQL Database created in Step-1 of this tutorial to the sample Node.js app created in Step-2.
Navigate to your deployed App Platform app, click the Create button on your deployed app’s dashboard, and click on the “Create/Attach Database”:
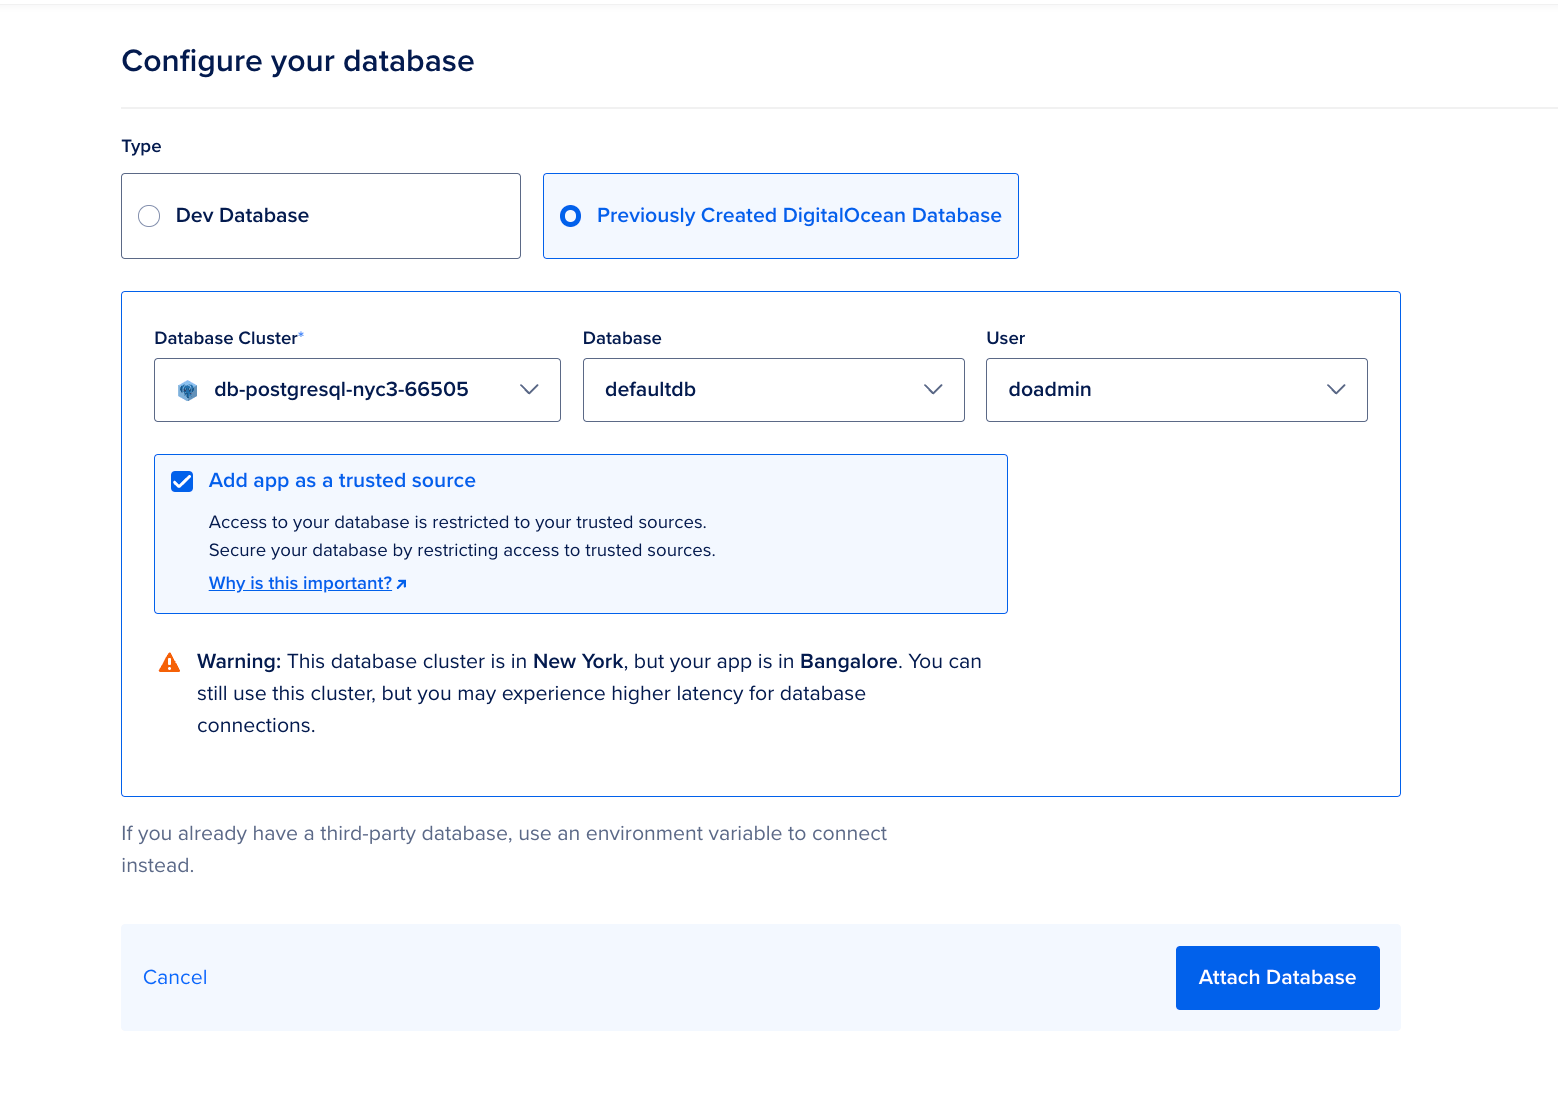
Next, select “Previously Created DigitalOcean Database” and choose the recently deployed Managed PostgreSQL database cluster, and click the “Attach Database” button at the bottom.
Note:- Make sure to check the App Platform app as a trusted resource checkbox. This creates a secure connection to the database and accepts traffic only from the app.
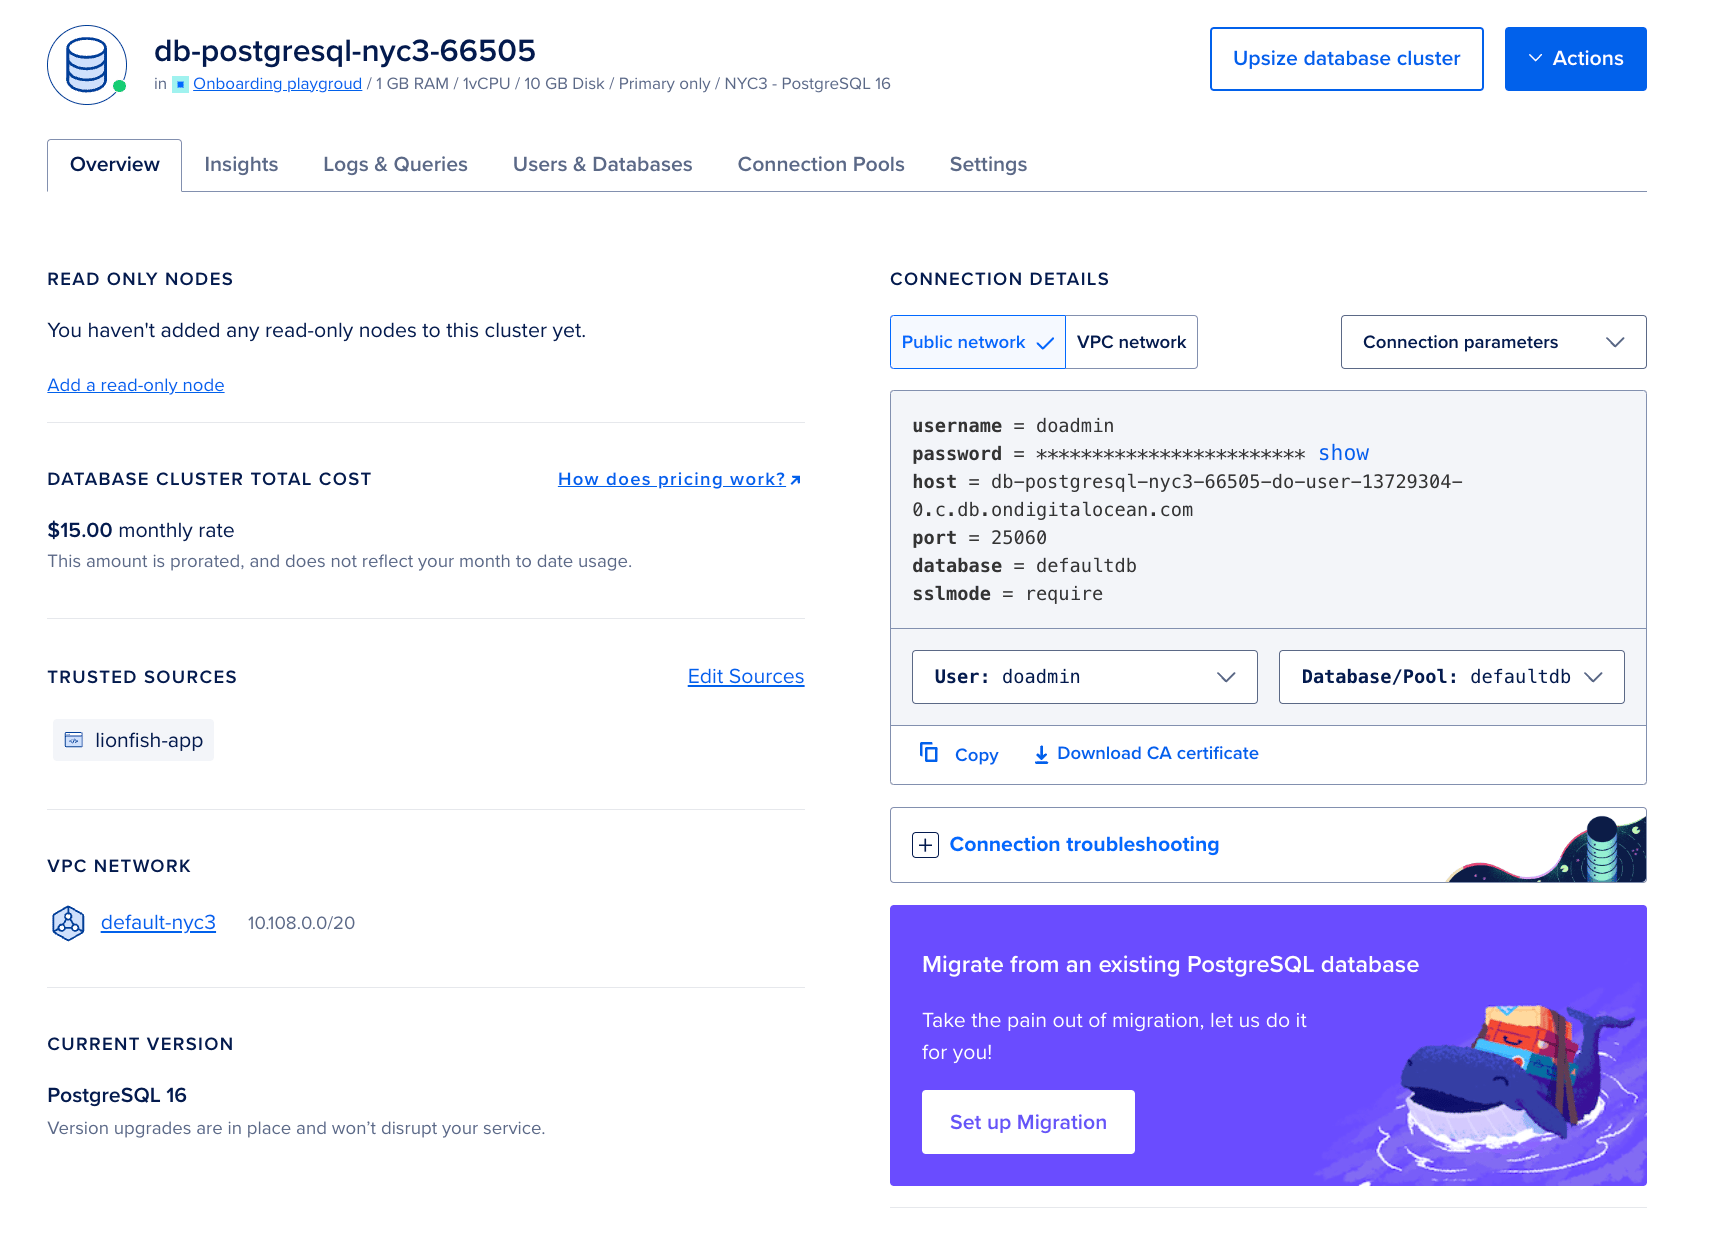
You can verify in the Database Overview section that the App Platform app has been successfully added as a Trusted source.
Step 4 - Get Scrapable Metrics from the /metrics endpoint
/metrics endpointYou can programmatically view your database cluster’s metrics via the /metrics endpoint. This endpoint includes over twenty times the metrics you can access in the Insights tab in the control panel.
You can access the metrics endpoint with a curl command or use Postman to visualize those metrics on a monitoring system like Prometheus.
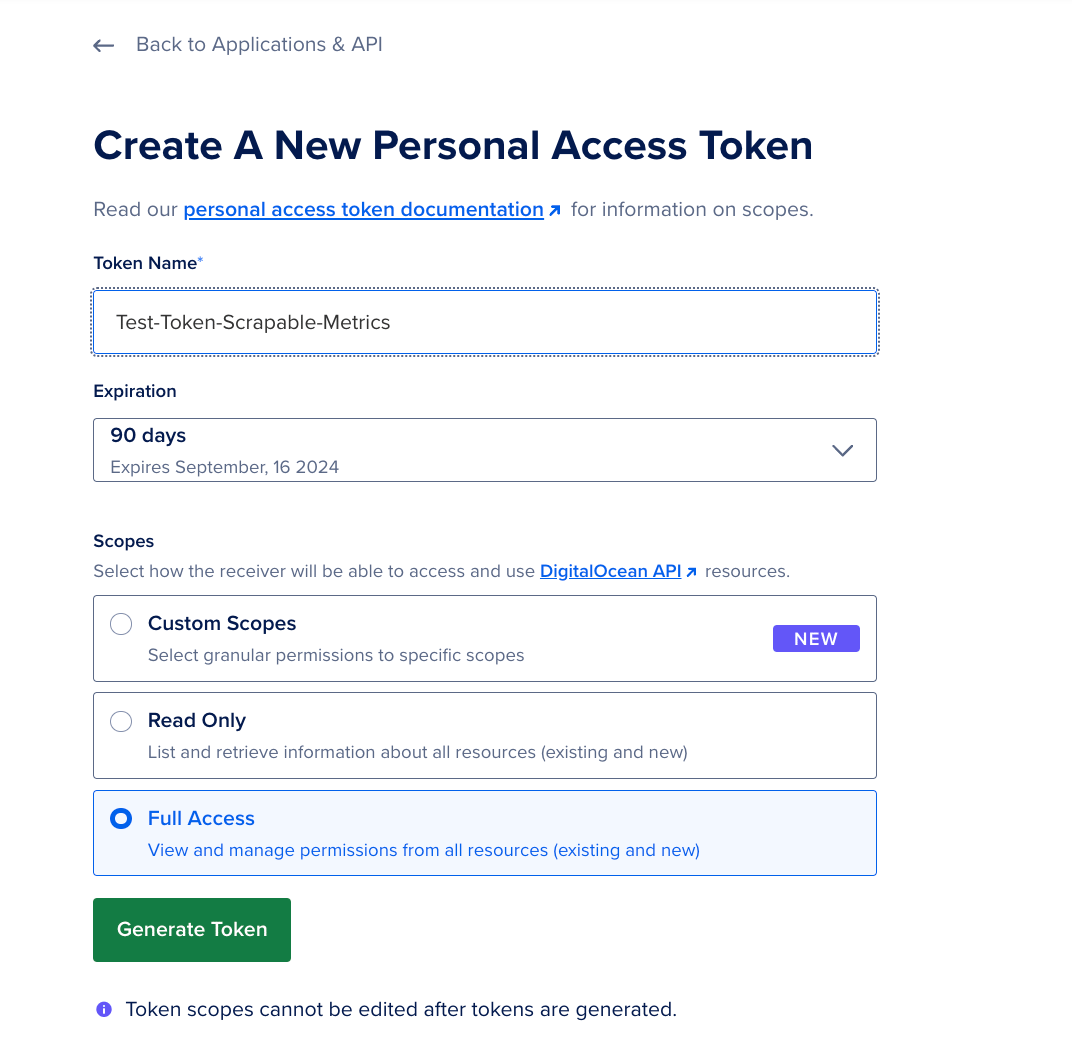
First and foremost, head to the API section on the DigitalOcean control panel and Create A New Personal Access Token and click Generate Token with Full Access. Please note the access token as you will need it in the steps below.
In this example, you will use Postman to execute all the HTTP requests. Or you can also execute the curl commands from your App platform app instance to get the response to the API requests.
Get the Hostname and Port
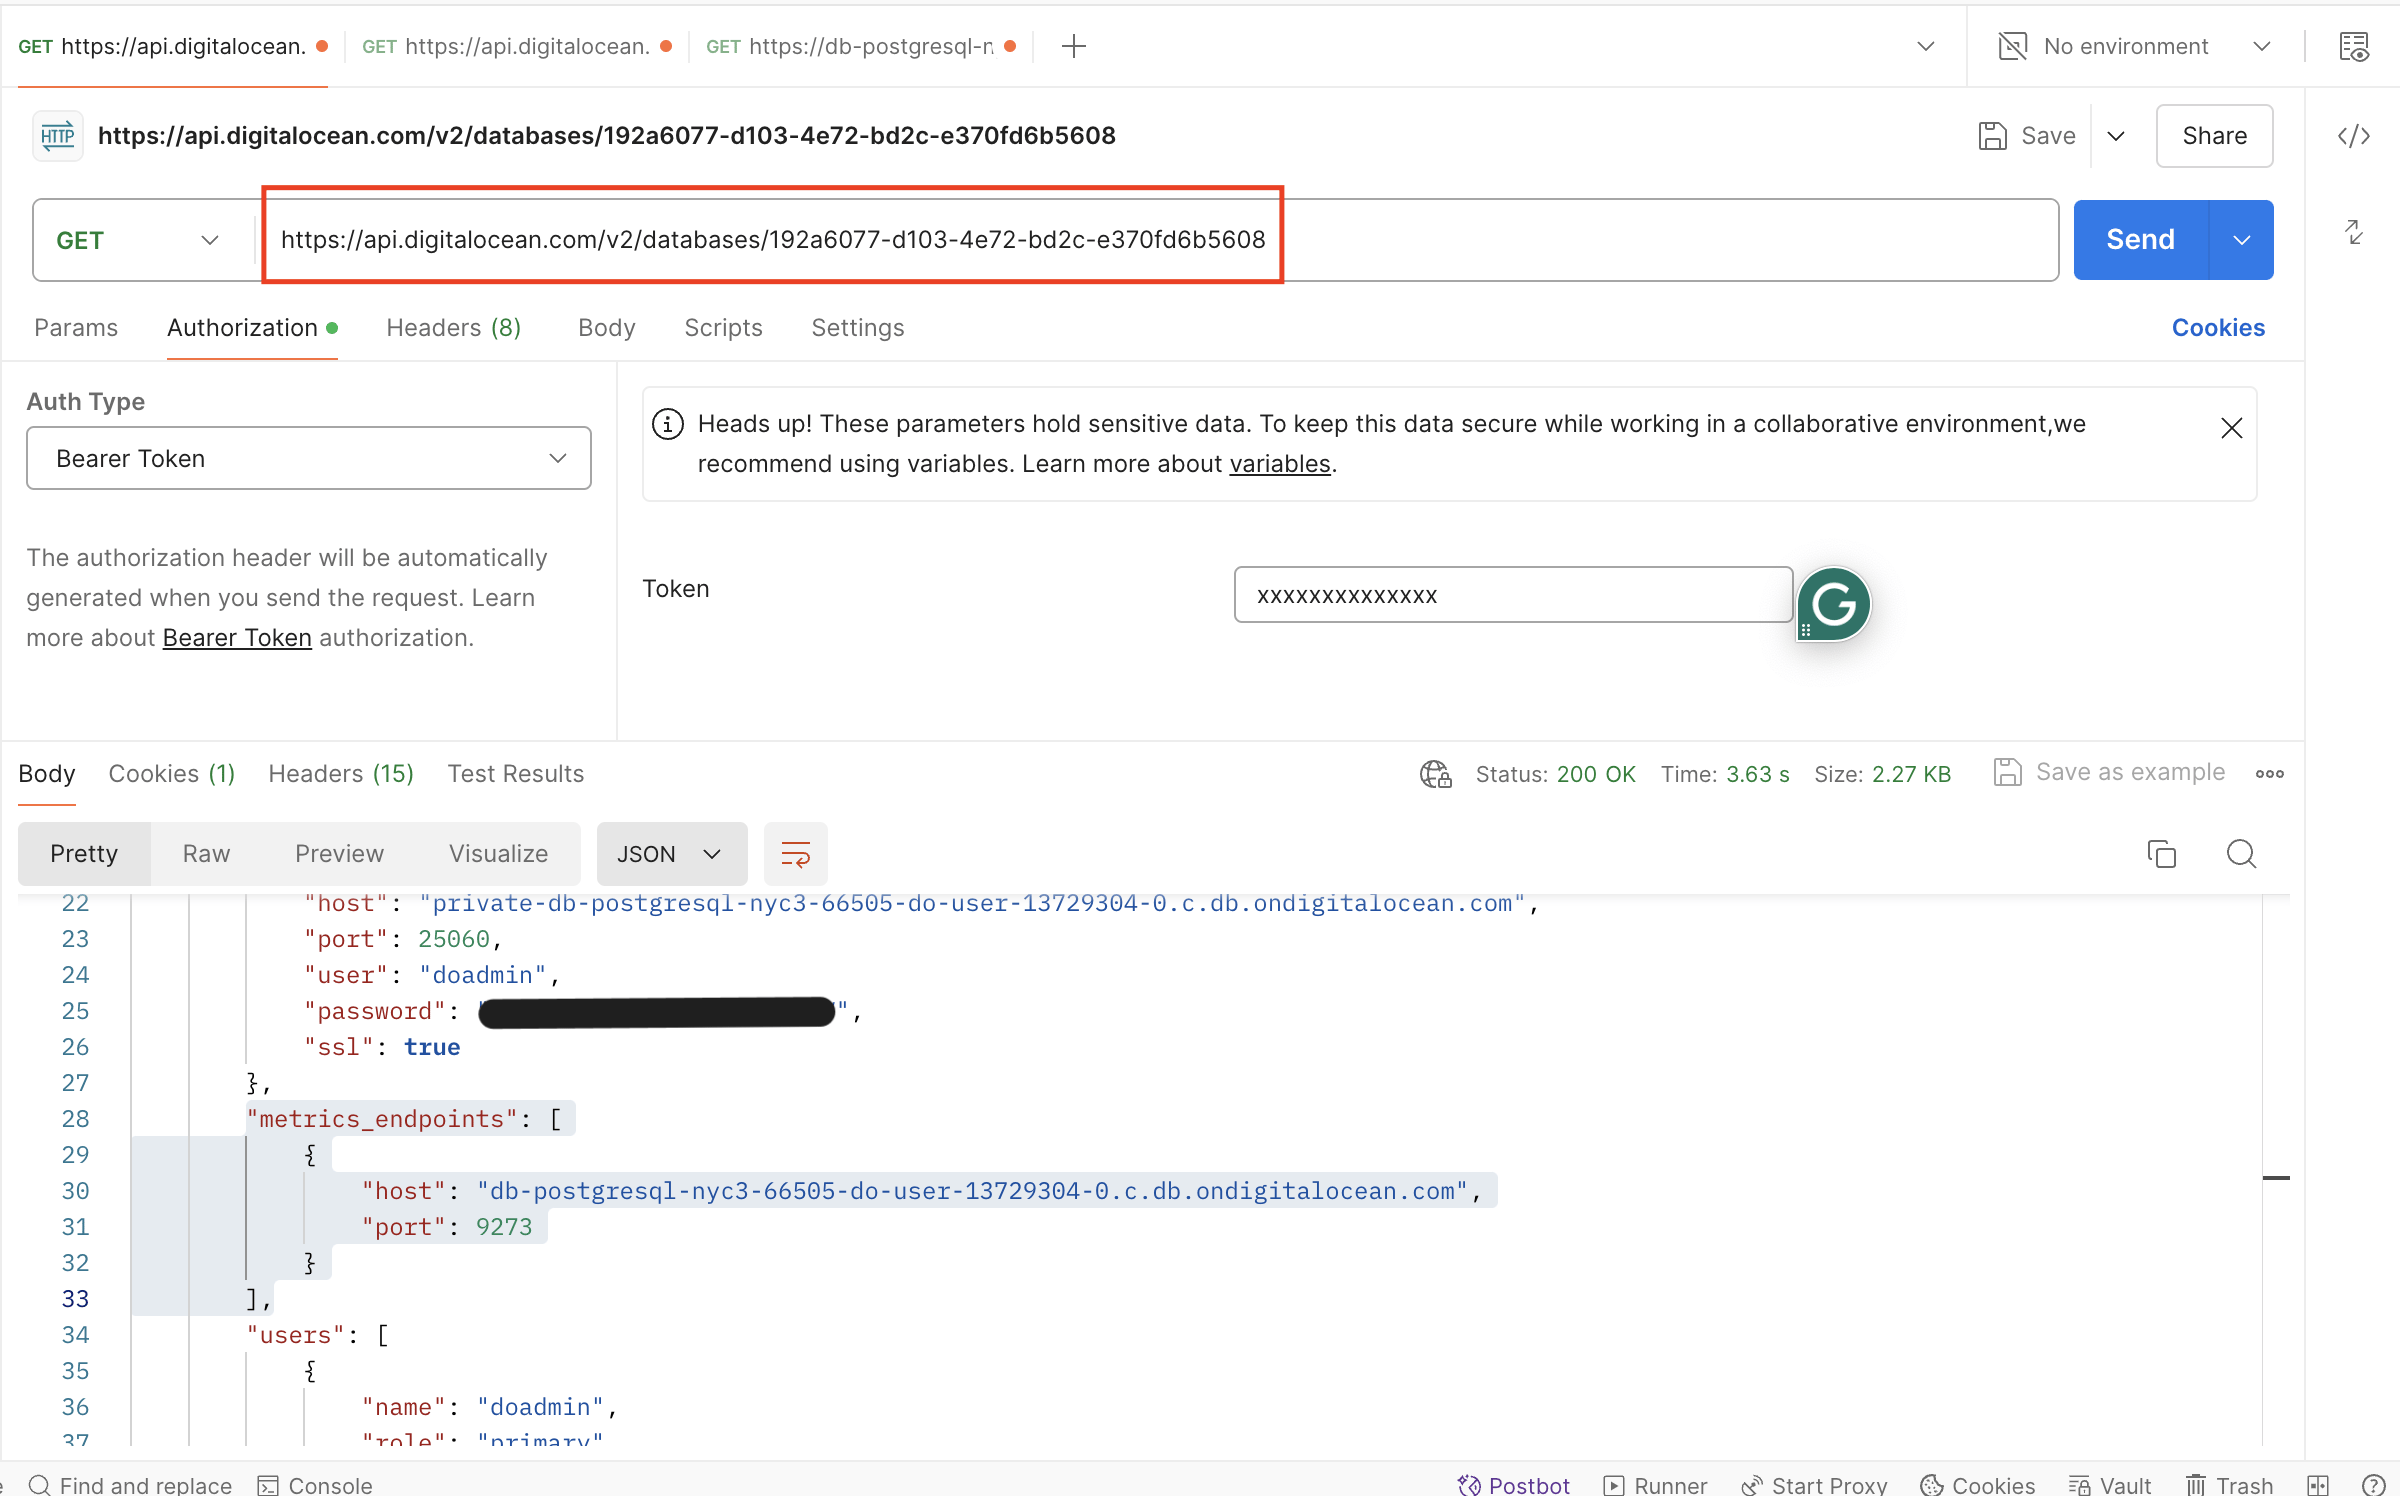
Firstly, you need to retrieve your cluster’s metrics hostname by sending a GET request to https://api.digitalocean.com/v2/databases/{UUID}.
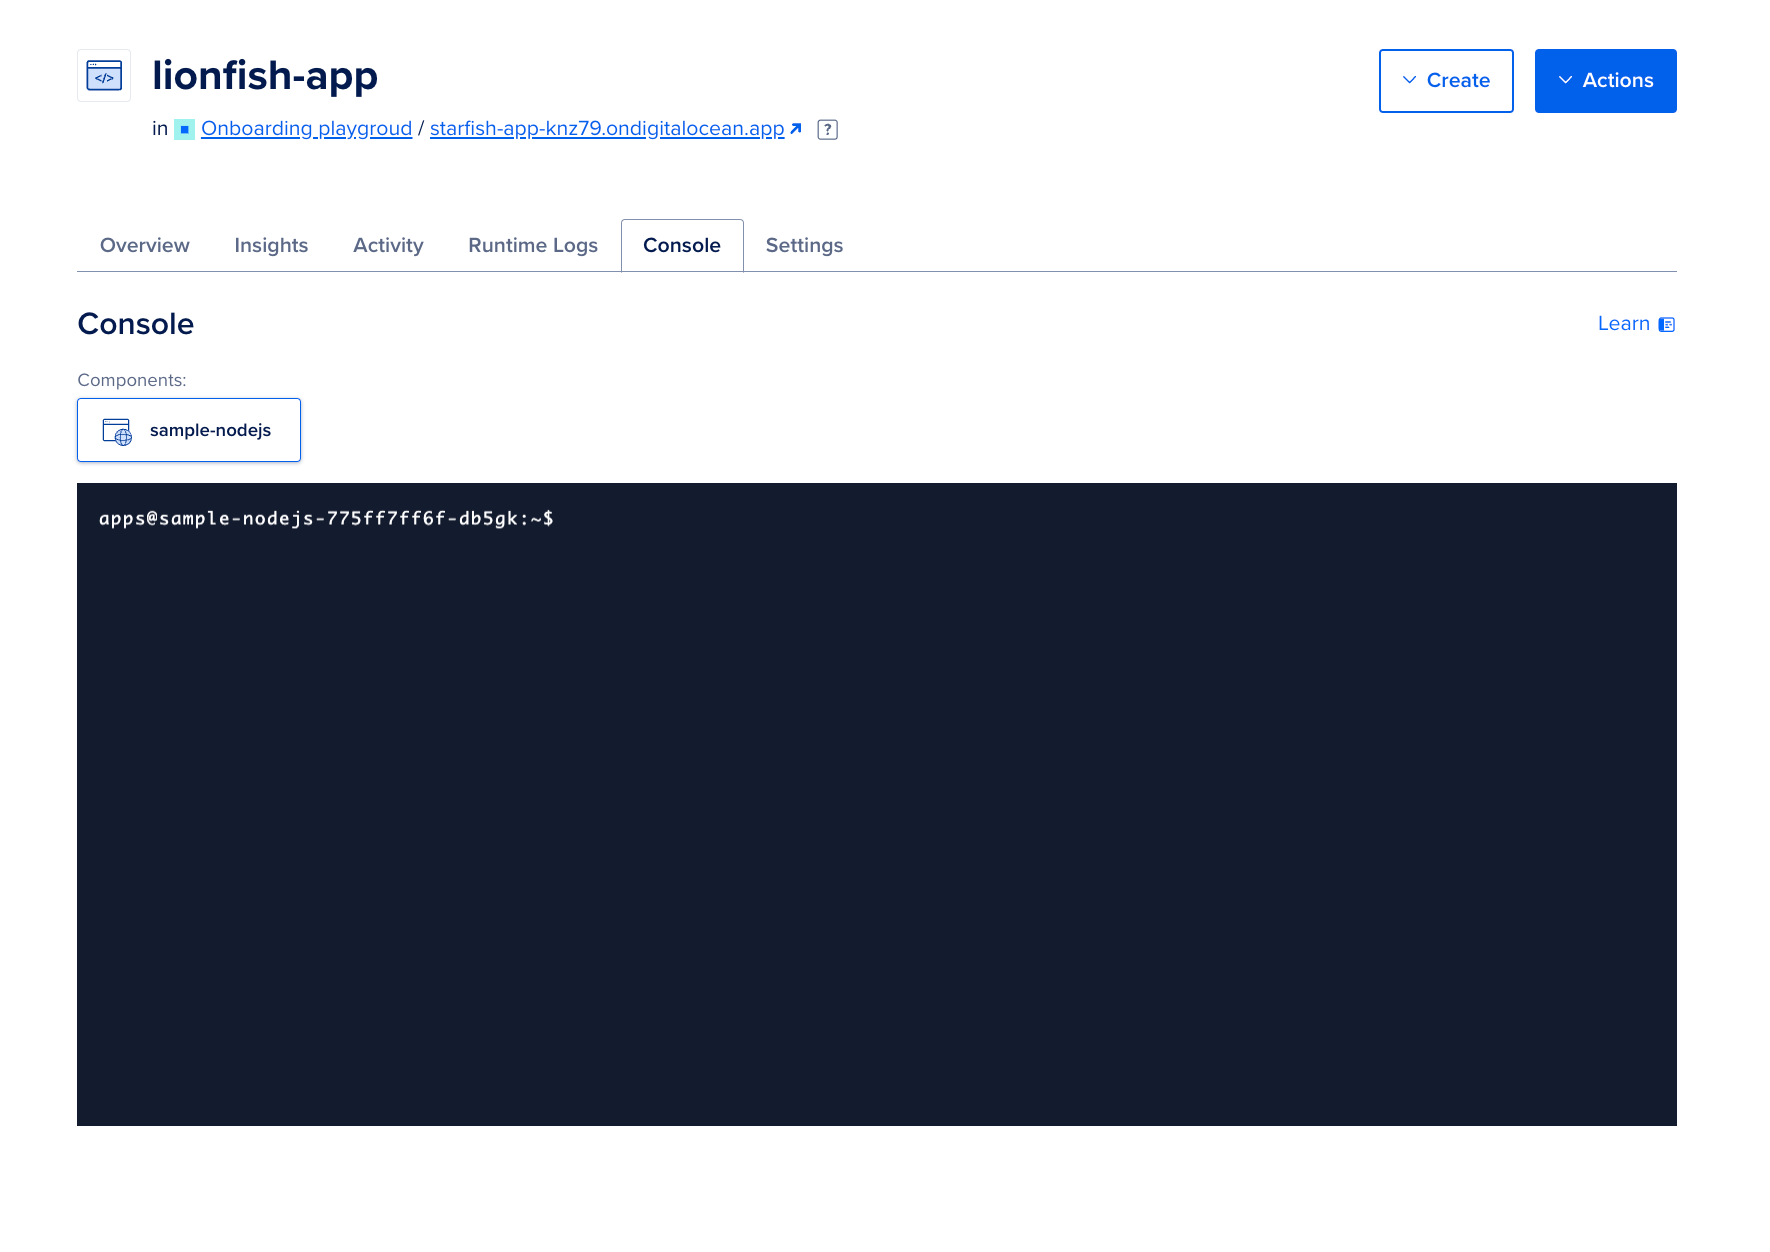
Execute the following curl command from your App platform application instance. Head over to the Console section to do so:
Use the following command to get the hostname and credentials of the database-
apps@sample-nodejs-775ff7ff6f-db5gk:~$ curl --silent -XGET --location 'https://api.digitalocean.com/v2/databases/{UUID}' --header 'Content-Type: application/json' --header "Authorization: Bearer $RO_DIGITALOCEAN_TOKEN"
Please replace the {UUID} and $RO_DIGITALOCEAN_TOKEN with the Managed PostgreSQL database’s UUID and your personal access token.
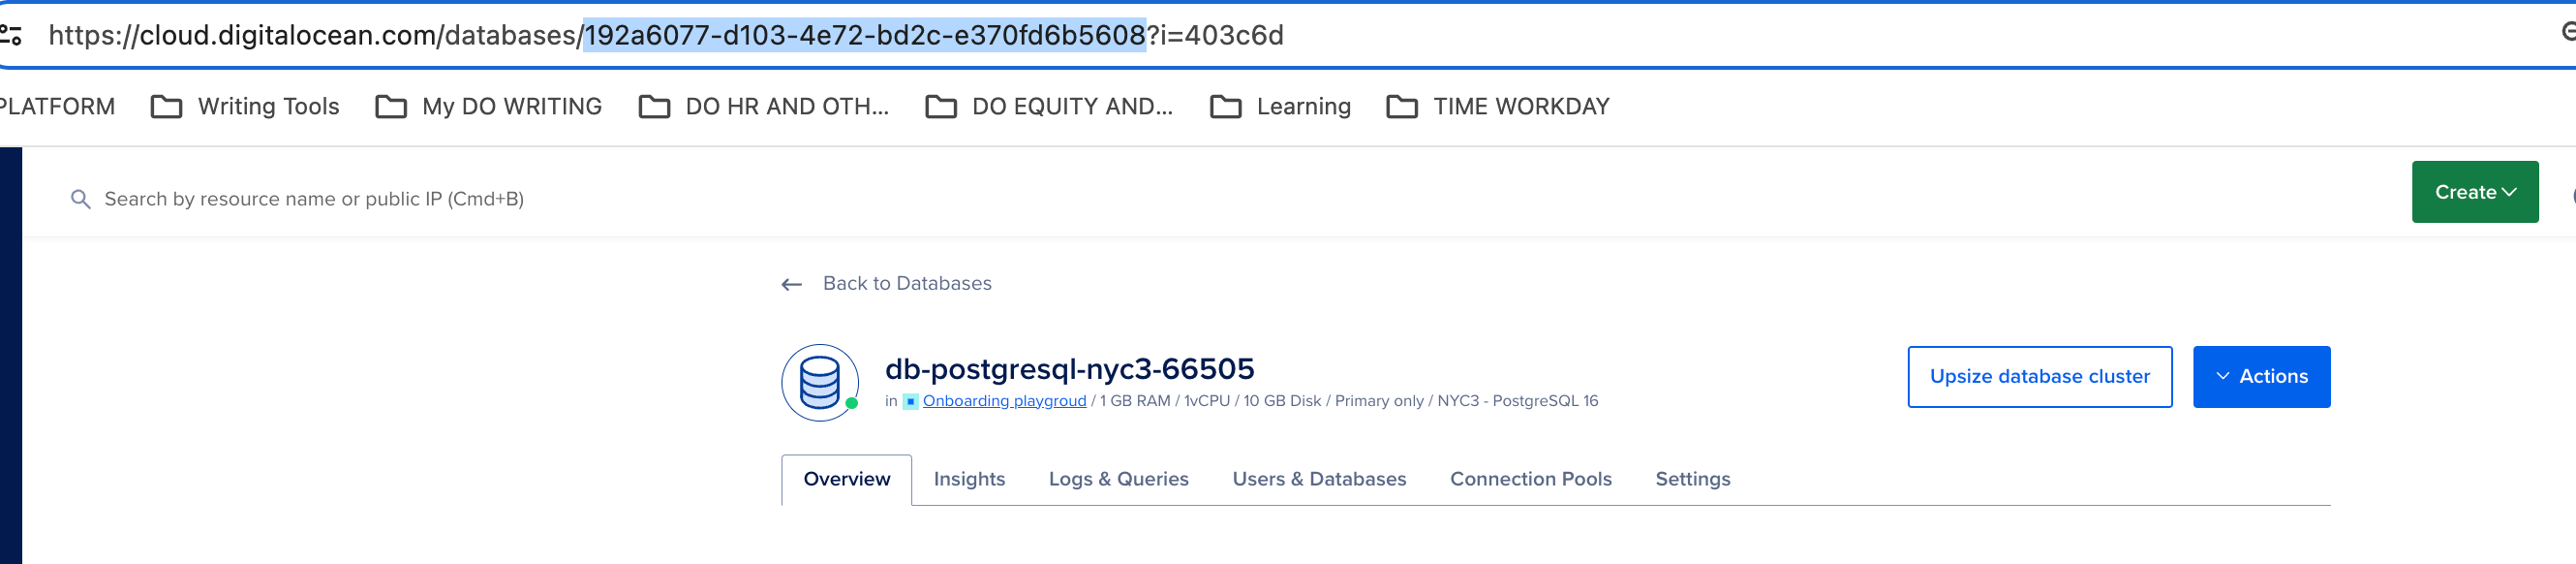
Note:- You can find the UUID of your database in the URL as shown in the highlighted text in the screenshot below.
The command should give you an output with the Managed PostgreSQL database cluster details:
Output
"database": {
        "id": "192a6077-d103-4e72-bd2c-e370fd6b5608",
        "name": "db-postgresql-nyc3-66505",
        "engine": "pg",
        "version": "16",
        "semantic_version": "16.3",
        "connection": {
            "protocol": "postgresql",
            "uri": "postgresql://doadmin:PASSWORD@db-postgresql-nyc3-66505-do-user-13729304-0.c.db.ondigitalocean.com:25060/defaultdb?sslmode=require",
            "database": "defaultdb",
            "host": "db-postgresql-nyc3-66505-do-user-13729304-0.c.db.ondigitalocean.com",
            "port": 25060,
            "user": "doadmin",
            "password": "PASSWORD",
            "ssl": true
        },
        "private_connection": {
            "protocol": "postgresql",
            "uri": "postgresql://doadmin:PASSWORD@private-db-postgresql-nyc3-66505-do-user-13729304-0.c.db.ondigitalocean.com:25060/defaultdb?sslmode=require",
            "database": "defaultdb",
            "host": "private-db-postgresql-nyc3-66505-do-user-13729304-0.c.db.ondigitalocean.com",
            "port": 25060,
            "user": "doadmin",
            "password": "PASSWORD",
            "ssl": true
        },
        "metrics_endpoints": [
            {
                "host": "db-postgresql-nyc3-66505-do-user-13729304-0.c.db.ondigitalocean.com",
                "port": 9273
            }
        ],
        "users": [
            {
                "name": "doadmin",
                "role": "primary",
                "password": "PASSWORD"
            }
        ],
        "db_names": [
            "defaultdb"
        ],
        "num_nodes": 1,
        "region": "nyc3",
        "status": "online",
        "created_at": "2024-06-10T21:04:32Z",
        "maintenance_window": {
            "day": "monday",
            "hour": "00:07:46",
            "pending": false
        },
        "size": "db-s-1vcpu-1gb",
        "tags": [
            "testtestnn"
        ],
        "private_network_uuid": "xxxxxxxxxx",
        "project_id": "xxxxxxxxxxx",
        "read_only": false,
        "version_end_of_life": "2028-11-09T00:00:00Z",
        "version_end_of_availability": "2028-05-09T00:00:00Z",
        "storage_size_mib": 10240
    }
}
In the above output, please note the host/port pair. In our case, the host is db-postgresql-nyc3-66505-do-user-13729304-0.c.db.ondigitalocean.com, and the port is 9273.
You can also execute the above HTTP GET request on Postman if you have Postman installed on your system and your system’s IP address added as a Trusted Source in Database Trusted Source settings.
Simply add the URL https://api.digitalocean.com/v2/databases/{UUID} and replace your personal access token under the Authorization tab with Auth Type selected as Bearer Token.
Get the Cluster’s metrics credentials
Next, you need your cluster’s metrics credentials. You can retrieve these by making a GET request to https://api.digitalocean.com/v2/databases/metrics/credentials with an admin or write token.
Use the following curl command from the App Platform app instance:
apps@sample-nodejs-775ff7ff6f-db5gk:~$ curl --silent -XGET --location 'https://api.digitalocean.com/v2/databases/metrics/credentials' --header 'Content-Type: application/json' --header "Authorization: Bearer xxxxxxxxxxxxxxxxx"
It should give you the cluster’s metrics credentials with the username and password.
Output{
    "credentials": {
        "basic_auth_username": "prom2prh",
        "basic_auth_password": "xxxxxxxxxxxxx"
    }
}
Access the /metrics endpoint
To access the endpoint using cURL, make a GET request to https://$HOST:9273/metrics, replacing the hostname, username, and password variables with the credentials you found in the previous steps:
apps@sample-nodejs-775ff7ff6f-db5gk:~$ curl -XGET -k -u $USERNAME:$PASSWORD https://$HOST:9273/metrics
It should give you lots of metadata like below:
Output...
1",project="do-user-13729304-0",service="db-postgresql-nyc3-66505",service_type="pg"} 0.7
# HELP system_n_cpus Telegraf collected metric
# TYPE system_n_cpus gauge
system_n_cpus{cloud="custom-digitalocean-do-nyc3",host="db-postgresql-nyc3-66505-1",project="do-user-13729304-0",service="db-postgresql-nyc3-66505",service_type="pg"} 1
# HELP system_n_unique_users Telegraf collected metric
# TYPE system_n_unique_users gauge
system_n_unique_users{cloud="custom-digitalocean-do-nyc3",host="db-postgresql-nyc3-66505-1",project="do-user-13729304-0",service="db-postgresql-nyc3-66505",service_type="pg"} 0
# HELP system_n_users Telegraf collected metric
# TYPE system_n_users gauge
system_n_users{cloud="custom-digitalocean-do-nyc3",host="db-postgresql-nyc3-66505-1",project="do-user-13729304-0",service="db-postgresql-nyc3-66505",service_type="pg"} 0
# HELP system_uptime Telegraf collected metric
# TYPE system_uptime counter
system_uptime{cloud="custom-digitalocean-do-nyc3",host="db-postgresql-nyc3-66505-1",project="do-user-13729304-0",service="db-postgresql-nyc3-66505",service_type="pg"} 640073
...
Step 5 - Visualize metrics with Prometheus
To access the endpoint using Prometheus, copy the following configuration into a file prometheus.yml, replacing the hostname, username, password, and path to CA cert. This configures Prometheus to use all the credentials necessary to access the endpoint:
# prometheus.yml
global:
  scrape_interval: 15s
  evaluation_interval: 15s

scrape_configs:
  - job_name: 'dbaas_cluster_metrics_svc_discovery'
    scheme: https
    tls_config:
      ca_file: /path/to/ca.crt
    dns_sd_configs:
    - names:
      - $TARGET_ADDRESS
      type: 'A'
      port: 9273
      refresh_interval: 15s
    metrics_path: '/metrics'
    basic_auth:
      username: $BASIC_AUTH_USERNAME
      password: $BASIC_AUTH_PASSWORD
Please replace $TARGET_ADDRESS, $BASIC_AUTH_USERNAME, and $BASIC_AUTH_PASSWORD with the hostname, username, and password obtained in the above steps.
Then, copy the following connection script into a file named up.sh. This script runs envsubst and starts a Prometheus container with the config from the previous step.
#!/bin/bash
envsubst < prometheus.yml > /tmp/dbaas-prometheus.yml

docker run -p 9090:9090 \
  -v /tmp/dbaas-prometheus.yml:/etc/prometheus/prometheus.yml \
  prom/prometheus
Go to http://localhost:9090/targets in a browser to confirm that multiple hosts are up and healthy.

Then, navigate to http://localhost:9090/graph to query Prometheus for the database metrics.

For more details, see the Prometheus DNS SD docs and TLS config docs.
You can check out this official PostgreSQL monitoring stats document to learn and understand each metric.
You can also read more about how to collect scrapable metrics for a managed PostgreSQL database.
Conclusion
This tutorial taught you how to set up and scrape metrics from a managed PostgreSQL database on DigitalOcean using a Node.js web application deployed on the DigitalOcean App Platform and Prometheus. By enabling scrapable metrics, you can easily monitor the performance and health of your databases, ensuring optimal operation and in-depth troubleshooting to fix any issues.
Thanks for learning with the DigitalOcean Community. Check out our offerings for compute, storage, networking, and managed databases.
About the author
I help Businesses scale with AI x SEO x (authentic) Content that revives traffic and keeps leads flowing | 3,000,000+ Average monthly readers on Medium | Sr Technical Writer(Team Lead) @ DigitalOcean | Ex-Cloud Consultant @ AMEX | Ex-Site Reliability Engineer(DevOps)@Nutanix
Still looking for an answer?
This textbox defaults to using Markdown to format your answer.
You can type !ref in this text area to quickly search our full set of tutorials, documentation & marketplace offerings and insert the link!
Hello,
thanks for writing this article!
Could you confirm, that the metrics from DO are not equal to the metrics that Postgres Exporter exposes? From the DO Metrics EP we receive 497 metrics and from the official postgres exporter we receive 1466. I am asking this because we would like to use a Grafana Template.
Currently, it seems like many metrics are missing.
Looking forward to your response!
 This work is licensed under a Creative Commons Attribution-NonCommercial- ShareAlike 4.0 International License.
Become a contributor for community
Get paid to write technical tutorials and select a tech-focused charity to receive a matching donation.

DigitalOcean Documentation
Full documentation for every DigitalOcean product.

Resources for startups and AI-native businesses
The Wave has everything you need to know about building a business, from raising funding to marketing your product.
The developer cloud
Scale up as you grow — whether you're running one virtual machine or ten thousand.

Start building today
From GPU-powered inference and Kubernetes to managed databases and storage, get everything you need to build, scale, and deploy intelligent applications.
