- Log in to:
- Community
- DigitalOcean
- Sign up for:
- Community
- DigitalOcean
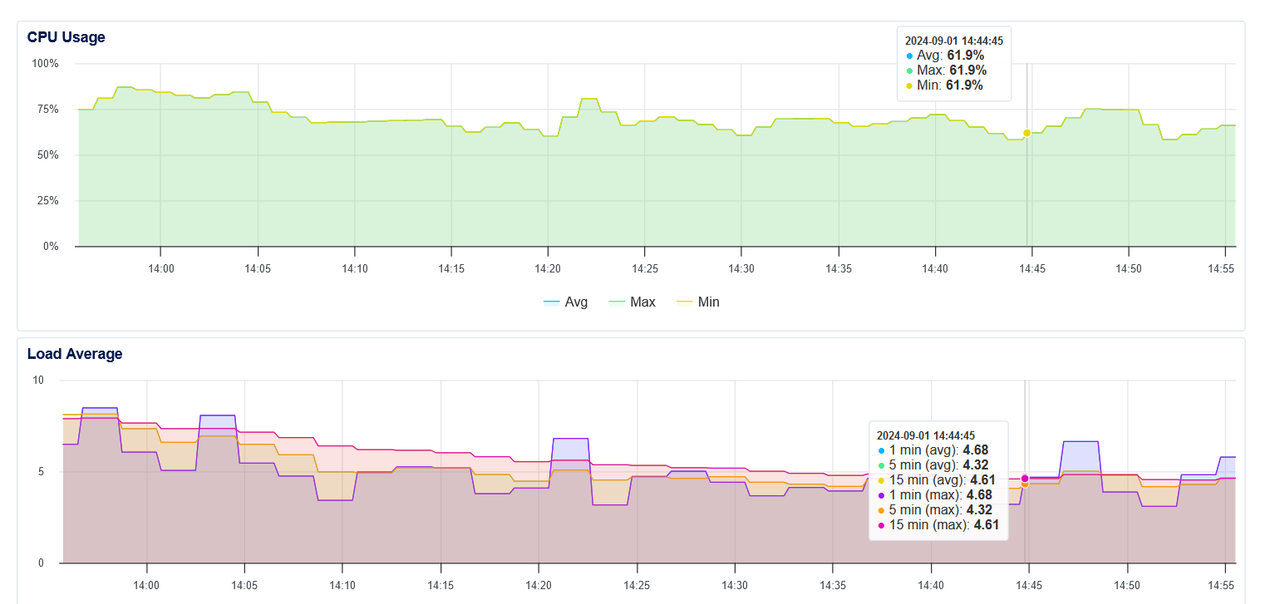
My managed Postgre database is showing a lot higher average load compared to CPU usage. How should I interpret this? (The cluster has 2 vCPU.)

As far as I understand, a CPU load of 2 would be 100% usage with 2vCPUs. I don’t understand why it’s maintaining 4-5 load with only 60-80% usage. (The load is not primarily from a single connection, btw, it’s spread over 6-10.)
If I go by load, my cluster seems way overloaded. But if I go by CPU usage, it seems healthy and fine.
This textbox defaults to using Markdown to format your answer.
You can type !ref in this text area to quickly search our full set of tutorials, documentation & marketplace offerings and insert the link!
Hey Adam,
The CPU Usage shows how much of the CPU’s capacity is being used.
And the Load Average on the other side, shows the number of processes waiting to run or running.
Even if your CPU usage is only 60-80%, the load average can still be high if there are a lot of processes waiting in line. This usually happens when your system is doing lots of disk I/O (like reading/writing to the disk), waiting for resources, or running many queries at the same time.
Since your cluster has 2 vCPUs, a load average of 2 would mean the CPUs are fully utilized. But since your load average is 4-5, it means there are more processes waiting to be handled by the CPU. This is why it seems overloaded by load average but looks fine on CPU usage.
You might want to check disk I/O and see if there are any slow queries or heavy operations that could be causing this.
You might also want to check out these guides here:
https://docs.digitalocean.com/products/databases/postgresql/how-to/monitor-databases/
Hope this clears things up!
- Bobby
Become a contributor for community
Get paid to write technical tutorials and select a tech-focused charity to receive a matching donation.
DigitalOcean Documentation
Full documentation for every DigitalOcean product.
Resources for startups and AI-native businesses
The Wave has everything you need to know about building a business, from raising funding to marketing your product.
Get our newsletter
Stay up to date by signing up for DigitalOcean’s Infrastructure as a Newsletter.
New accounts only. By submitting your email you agree to our Privacy Policy
The developer cloud
Scale up as you grow — whether you're running one virtual machine or ten thousand.
Start building today
From GPU-powered inference and Kubernetes to managed databases and storage, get everything you need to build, scale, and deploy intelligent applications.