- Log in to:
- Community
- DigitalOcean
- Sign up for:
- Community
- DigitalOcean

Status: Deprecated
This article covers a data shipper that has been replaced as of version 5.0 of Elasticsearch. This guide might still be useful as a reference, but will not work with up-to-date elements of the Elastic Stack.
Reason: Topbeat was replaced in the Elastic Stack as of version 5.0. Because of this, this guide will no longer be maintained.
See Instead: If you are currently using Topbeat, we highly recommend replacing it with Metricbeat using the following tutorials:
Introduction
Topbeat, which is one of the several “Beats” data shippers that helps send various types of server data to an Elasticsearch instance, allows you to gather information about the CPU, memory, and process activity on your servers. When used with the ELK stack (Elasticsearch, Logstash, and Kibana), Topbeat can be used as an alternative to other system metrics visualization tools such as Prometheus or Statsd.
In this tutorial, we will show you how to use an ELK stack to gather and visualize infrastructure metrics by using Topbeat on an Ubuntu 14.04 server.
Prerequisites
This tutorial assumes that you have the ELK Stack setup described in this tutorial: How To Install Elasticsearch, Logstash, and Kibana on Ubuntu 14.04. If you do not already have an ELK server, please complete the linked tutorial before continuing.
We will also assume that, in addition to the ELK server, you have at least one client Ubuntu 14.04 server that you want to gather system metrics from by using Topbeat.
Load Kibana Dashboards on ELK Server
Note: This step is from the prerequisite tutorial but is also included here in case you skipped it while setting up your ELK stack. It is safe to load the sample dashboards multiple times.
Elastic provides several sample Kibana dashboards and Beats index patterns that can help you get started with Kibana. Although we won’t use the dashboards in this tutorial, we’ll load them anyway so we can use the Filebeat index pattern that it includes.
First, download the sample dashboards archive to your home directory:
- cd ~
- curl -L -O https://download.elastic.co/beats/dashboards/beats-dashboards-1.1.0.zip
Install the unzip package with this command:
- sudo apt-get -y install unzip
Next, extract the contents of the archive:
- unzip beats-dashboards-*.zip
And load the sample dashboards, visualizations and Beats index patterns into Elasticsearch with these commands:
- cd beats-dashboards-*
- ./load.sh
These are the index patterns that we just loaded:
- [packetbeat-]YYYY.MM.DD
- [topbeat-]YYYY.MM.DD
- [filebeat-]YYYY.MM.DD
- [winlogbeat-]YYYY.MM.DD
Load Topbeat Index Template in Elasticsearch
Because we are planning on using Topbeat to ship logs to Elasticsearch, we should load the Topbeat index template. The index template will configure Elasticsearch to analyze incoming Topbeat fields in an intelligent way.
First, download the Topbeat index template to your home directory:
- cd ~
- curl -O https://raw.githubusercontent.com/elastic/topbeat/master/etc/topbeat.template.json
Then load the template with this command:
- curl -XPUT 'http://localhost:9200/_template/topbeat' -d@topbeat.template.json
Now your ELK server is ready to accept data from Topbeat. Let’s set up Topbeat on a client server next.
Set Up Topbeat (Add Client Servers)
Do these steps for each Ubuntu or Debian server that you want to send metrics data to Logstash on your ELK Server. For instructions on installing Topbeat on Red Hat-based Linux distributions (e.g. RHEL, CentOS, etc.), refer to the CentOS variation of this tutorial.
Copy SSL Certificate
Note: This step is from the prerequisite tutorial but is also included here in case the client server you are setting up hasn’t ever been connected to your ELK stack. You may skip this section if the client server already has the ELK server’s SSL certificate in the appropriate place.
On your ELK Server, copy the SSL certificate—created in the prerequisite tutorial—to your Client Server (substitute the client server’s address, and your own login):
- scp /etc/pki/tls/certs/logstash-forwarder.crt user@client_server_private_address:/tmp
After providing your login’s credentials, ensure that the certificate copy was successful. It is required for communication between the client servers and the ELK Server.
Now, on your Client Server, copy the ELK Server’s SSL certificate into the appropriate location (/etc/pki/tls/certs):
- sudo mkdir -p /etc/pki/tls/certs
- sudo cp /tmp/logstash-forwarder.crt /etc/pki/tls/certs/
Now we can install the Topbeat package.
Install Topbeat Package
On Client Server, ensure that the Beats source list exists. Open /etc/apt/sources.list.d/beats.list for editing:
- sudo vi /etc/apt/sources.list.d/beats.list
Ensure that this line exists (paste it in if it isn’t already present):
- deb https://packages.elastic.co/beats/apt stable main
Save and exit.
Topbeat uses the same GPG key as Elasticsearch and Filebeat, which can be installed with this command:
- wget -qO - https://packages.elastic.co/GPG-KEY-elasticsearch | sudo apt-key add -
Then install the Topbeat package:
- sudo apt-get update
- sudo apt-get install topbeat
Tobeat is now installed but not yet configured.
Configure Topbeat
Now we will configure Topbeat to connect to Logstash on our ELK Server. This section will step you through modifying the example configuration file that comes with Topbeat. When you complete the steps, you should have a file that looks something like this.
On Client Server, create and edit Topbeat configuration file:
- sudo vi /etc/topbeat/topbeat.yml
Note: Topbeat’s configuration file is in YAML format, which means that indentation is very important! Be sure to use the same number of spaces that are indicated in these instructions.
Near the top of the file, you will see the input section, which is where you can specify which metrics and statistics should be sent to the ELK server. We’ll use the default input settings, but feel free to change it to fit your needs.
Under the output section, find the line that says elasticsearch:, which indicates the Elasticsearch output section (which we are not going to use). Delete or comment out the entire Elasticsearch output section (up to the line that says #logstash:).
Find the commented out Logstash output section, indicated by the line that says #logstash:, and uncomment it by deleting the preceding #. In this section, uncomment the hosts: ["localhost:5044"] line. Change localhost to the private IP address (or hostname, if you went with that option) of your ELK server:
  ### Logstash as output
  logstash:
    # The Logstash hosts
    hosts: ["ELK_server_private_IP:5044"]
This configures Topbeat to connect to Logstash on your ELK Server at port 5044 (the port that we specified a Logstash input for in the prerequisite tutorial).
Next, find the tls section, and uncomment it. Then uncomment the line that specifies certificate_authorities, and change its value to ["/etc/pki/tls/certs/logstash-forwarder.crt"]. It should look something like this:
...
    tls:
      # List of root certificates for HTTPS server verifications
      certificate_authorities: ["/etc/pki/tls/certs/logstash-forwarder.crt"]
This configures Topbeat to use the SSL certificate that we created on the ELK Server in the prerequisite tutorial.
Save and quit.
Now restart Topbeat to put our changes into place:
- sudo service topbeat restart
- sudo update-rc.d topbeat defaults 95 10
Again, if you’re not sure if your Topbeat configuration is correct, compare it against this example Topbeat configuration.
Now Topbeat is sending your client server’s system, processes, and filesystem metrics to your ELK server! Repeat this section for all of the other servers that you wish to Topbeat metrics for.
Test Topbeat Installation
If your ELK stack is setup properly, Topbeat (on your client server) should be shipping your logs to Logstash on your ELK server. Logstash should be loading the Topbeat data into Elasticsearch in an date-stamped index, topbeat-YYYY.MM.DD.
On your ELK Server, verify that Elasticsearch is indeed receiving the data by querying for the Topbeat index with this command:
- curl -XGET 'http://localhost:9200/topbeat-*/_search?pretty'
You should see a bunch of output that looks like this:
Sample Output:{
      "_index" : "topbeat-2016.02.01",
      "_type" : "process",
      "_id" : "AVKeLSdP4HKUFv4CjZ7K",
      "_score" : 1.0,
      "_source":{"@timestamp":"2016-02-01T18:51:43.937Z","beat":{"hostname":"topbeat-01","name":"topbeat-01"},"count":1,"proc":{"cpu":{"user":0,"user_p":0,"system":50,"total":50,"start_time":"12:54"},"mem":{"size":0,"rss":0,"rss_p":0,"share":0},"name":"jbd2/vda1-8","pid":125,"ppid":2,"state":"sleeping"},"type":"process","@version":"1","host":"topbeat-01"}
}
If your output shows 0 total hits, Elasticsearch is not loading any Topbeat data under the index you searched for, and you should review your setup for errors. If you received the expected output, continue to the next step.
Connect to Kibana
When you are finished setting up Topbeat on all of the servers that you want to gather system stats for, let’s look at Kibana.
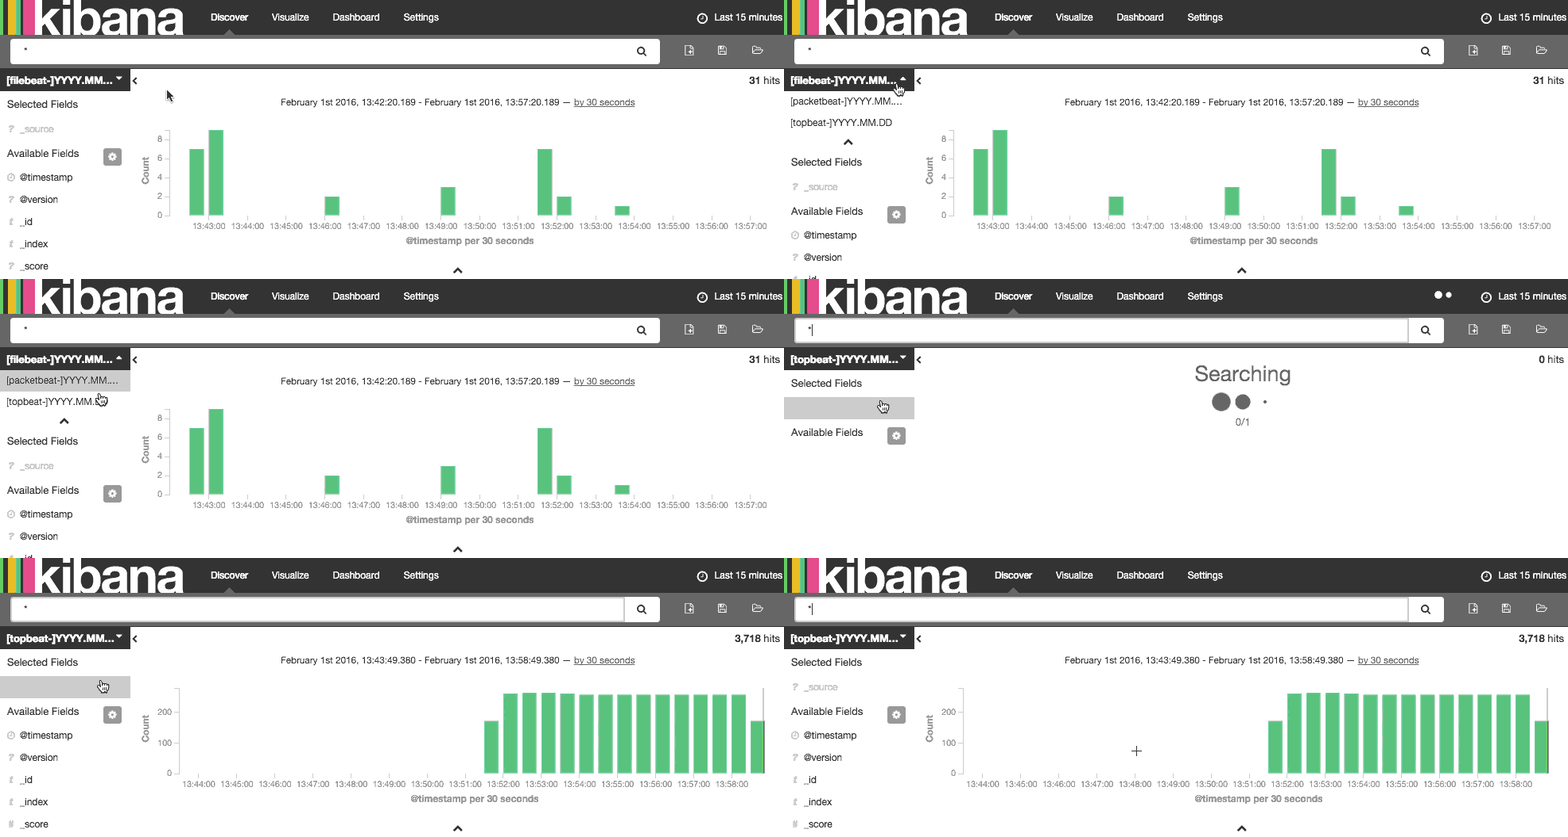
In a web browser, go to the FQDN or public IP address of your ELK Server. After entering your ELK server’s credentials, you should see your Kibana Discover page.
Go ahead and select [topbeat]-YYY.MM.DD from the Index Patterns menu (left side) to view your Topbeat data in the Discover view:

Here, you can search and drill down your various Topbeat entries.
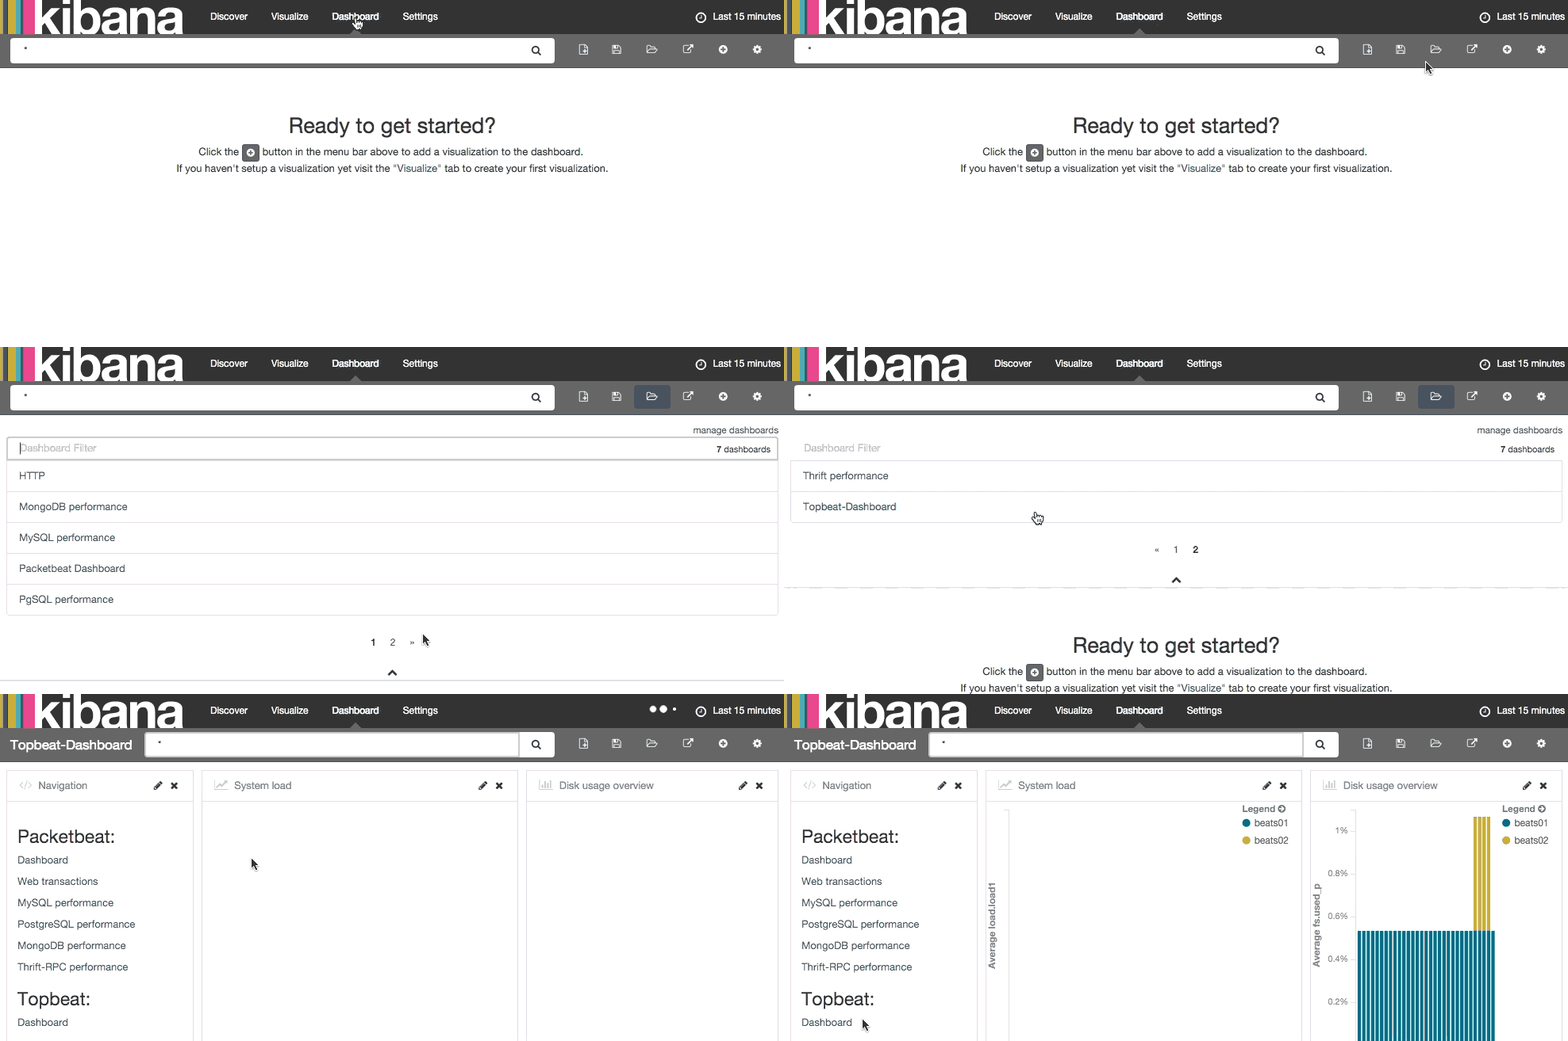
Next, you will want to check out the sample Topbeat dashboard that we loaded earlier. Click on Dashboard (top), then click the Load Saved Dashboard icon. Navigate to the second page of dashboards then click on Topbeat-Dashboard:

Here, you will see a variety of metrics that were gathered from your client servers that you installed Topbeat on.
Conclusion
Now that your system metrics are centralized via Elasticsearch and Logstash, and you are able to visualize them with Kibana, you should be able to see what your servers are up to at a glance. Good luck!
Thanks for learning with the DigitalOcean Community. Check out our offerings for compute, storage, networking, and managed databases.
Tutorial Series: Centralized Logging with ELK Stack (Elasticsearch, Logstash, and Kibana) On Ubuntu 14.04
Centralized logging can be very useful when attempting to identify problems with your servers or applications, as it allows you to search through all of your logs in a single place. It is also useful because it allows you to identify issues that span multiple servers by correlating their logs during a specific time frame.
This series will teach you how to install Logstash and Kibana on Ubuntu, then how to add more filters to structure your log data. Then it will teach you how to use Kibana.
About the author
Software Engineer @ DigitalOcean. Former Señor Technical Writer (I no longer update articles or respond to comments). Expertise in areas including Ubuntu, PostgreSQL, MySQL, and more.
Still looking for an answer?
This textbox defaults to using Markdown to format your answer.
You can type !ref in this text area to quickly search our full set of tutorials, documentation & marketplace offerings and insert the link!
Hey Mitchell,
Having trouble getting a client-server to use topbeat to talk to my elk server. If I run:
/usr/bin/topbeat -v -e -c /etc/topbeat/topbeat.yml
Then I get the following:
2016/02/03 22:16:01.710832 geolite.go:24: INFO GeoIP disabled: No paths were set under output.geoip.paths
2016/02/03 22:16:01.711531 logstash.go:106: INFO Max Retries set to: 3
2016/02/03 22:16:01.796348 outputs.go:119: INFO Activated logstash as output plugin.
2016/02/03 22:16:01.796621 publish.go:288: INFO Publisher name: indus
2016/02/03 22:16:01.797106 async.go:78: INFO Flush Interval set to: 1s
2016/02/03 22:16:01.797175 async.go:84: INFO Max Bulk Size set to: 2048
2016/02/03 22:16:01.797385 beat.go:147: INFO Init Beat: topbeat; Version: 1.1.0
2016/02/03 22:16:01.798470 beat.go:173: INFO topbeat sucessfully setup. Start running.
2016/02/03 22:20:22.803489 single.go:76: INFO Error publishing events (retrying): EOF
2016/02/03 22:20:22.803540 single.go:152: INFO send fail
2016/02/03 22:20:22.803560 single.go:159: INFO backoff retry: 1s
2016/02/03 22:20:38.840326 transport.go:125: ERR SSL client failed to connect with: dial tcp {elk_server_ip_redacted}:5044: getsockopt: connection refused
2016/02/03 22:20:38.840419 single.go:126: INFO Connecting error publishing events (retrying): dial tcp {elk_server_ip_redacted}:5044: getsockopt: connection refused
2016/02/03 22:20:38.840442 single.go:152: INFO send fail
2016/02/03 22:20:38.840461 single.go:159: INFO backoff retry: 2s
The same client-server is able to talk to the elk server using the same cert with which topbeat is using.
I’m assuming the problem is on the elk server end. How can I best debug there to isolate the problem?
Thanks,
Jimmyb
is there a script that displays information resource ram like this script https://backlinkdo.com/status/…
I want to see the graphic ram picture without terminal… by a matter of hours…
Hi
in the first tutorial you propose to install filebeat as log shipper to ELK. And now in this you tell us to install topbeat. Is not redundant? Would shipper we have to install? Filebeat or topbeat?
Thanks!
The file associated with this command to download the topbeat.template is not available. It returns a 404 File not found error.
curl -O https://raw.githubusercontent.com/elastic/topbeat/master/etc/topbeat.template.json
Topbeat was working perfectly but after a while I wasn’t able to see the dashboard since there was no incomming data in Kibana…
Hi!
curl -XPUT ‘http://localhost:9200/_template/topbeat’ -d@topbeat.template.json
is returning this error:
{“error”:{“root_cause”:[{“type”:“parse_exception”,“reason”:“Failed to derive xcontent”}],“type”:“parse_exception”,“reason”:“Failed to derive xcontent”},“status”:400}
- Table of contents
- **Status:** Deprecated
- Prerequisites
- Load Kibana Dashboards on ELK Server
- Load Topbeat Index Template in Elasticsearch
- Set Up Topbeat (Add Client Servers)
- Test Topbeat Installation
- Connect to Kibana
- Conclusion
Deploy on DigitalOcean
Click below to sign up for DigitalOcean's virtual machines, Databases, and AIML products.
Become a contributor for community
Get paid to write technical tutorials and select a tech-focused charity to receive a matching donation.
DigitalOcean Documentation
Full documentation for every DigitalOcean product.
Resources for startups and AI-native businesses
The Wave has everything you need to know about building a business, from raising funding to marketing your product.
Get our newsletter
Stay up to date by signing up for DigitalOcean’s Infrastructure as a Newsletter.
New accounts only. By submitting your email you agree to our Privacy Policy
The developer cloud
Scale up as you grow — whether you're running one virtual machine or ten thousand.
Get started for free
Sign up and get $200 in credit for your first 60 days with DigitalOcean.*
*This promotional offer applies to new accounts only.
