By Vadym Kalsin and Brian Hogan
Not using Ubuntu 16.04?
Choose a different version or distribution.
Introduction
Nagios is a popular open-source monitoring system. It keeps an inventory of your servers and monitors them so you know your critical services are up and running. Using a monitoring system like Nagios is an essential tool for any production environment, because by monitoring uptime, CPU usage, or disk space, you can head off problems before they occur, or before your users call you.
In this tutorial, you’ll install Nagios 4 and configure it so you can monitor host resources via Nagios’ web interface. You’ll also set up the Nagios Remote Plugin Executor (NRPE), which runs as an agent on remote hosts so you can monitor their resources.
Prerequisites
To complete this tutorial, you will need the following:
- Two Ubuntu 16.04 servers with private networking configured, set up by following the Ubuntu 16.04 initial server setup guide, including a sudo non-root user and a firewall. You’ll use the first server to run Nagios, and the second server will be configured as a remote host that Nagios can monitor.
- The server that will run Nagios also needs Apache and PHP installed, which you can do by following How To Install Linux, Apache, MySQL, PHP (LAMP stack) on Ubuntu 16.04 . You can skip the MySQL steps in that tutorial.
- Typically, Nagios runs behind a hardware firewall or VPN. If your Nagios server is exposed to the public Internet, you should secure the Nagios web interface with TLS. To do this, you should do one of the following:
- Configure a domain name to point to your server. You can learn how to point domains to DigitalOcean Droplets by following the How To Set Up a Host Name with DigitalOcean tutorial, and then follow How To Secure Apache with Let’s Encrypt on Ubuntu 16.04 to set up HTTPS support
- Secure Apache with a self-signed certificate by following How To Create a Self-Signed SSL Certificate for Apache in Ubuntu 16.04
This tutorial assumes that your servers have private networking enabled so that monitoring happens on the private network rather than the public network. If you don’t have private networking enabled, you can still follow this tutorial by replacing all the references to private IP addresses with public IP addresses.
Step 1 — Installing Nagios 4
There are multiple ways to install Nagios, but we’ll install Nagios and its components from source to ensure we get the latest features, security updates, and bug fixes.
Log into your server that runs Apache. We’ll call this the Nagios server.
- ssh sammy@your_nagios_server_ip
Create a nagios user and nagcmd group. You’ll use these to run the Nagios process.
- sudo useradd nagios
- sudo groupadd nagcmd
Then add the user to the group:
- sudo usermod -a -G nagcmd nagios
Because we are building Nagios and its components from source, we must install a few development libraries to complete the build, including compilers, development headers, and OpenSSL.
Update your package lists to ensure you can download the latest versions of the prerequisites:
- sudo apt-get update
Then install the required packages:
- sudo apt-get install build-essential libgd2-xpm-dev openssl libssl-dev unzip
With the prerequisites installed, we can install Nagios itself. Download the source code for the latest stable release of Nagios Core. Go to the Nagios downloads page, and click the Skip to download link below the form. Copy the link address for the latest stable release so you can download it to your Nagios server.
Download the release to your home directory with the curl command:
- cd ~
- curl -L -O https://assets.nagios.com/downloads/nagioscore/releases/nagios-4.3.4.tar.gz
Extract the Nagios archive:
- tar zxf nagios-*.tar.gz
Then change to the extracted directory:
- cd nagios-*
Before building Nagios, run the configure script to specify the user and group you want Nagios to use. Use the nagios user and nagcmd group you created:
- ./configure --with-nagios-group=nagios --with-command-group=nagcmd
If you want Nagios to send emails using Postfix, you must install Postfix and configure Nagios to use it by adding --with-mail=/usr/sbin/sendmail to the configure command. We won’t cover Postfix in this tutorial, but if you choose to use Postfix and Nagios later, you’ll need to reconfigure and reinstall Nagios to use Postfix support.
You’ll see the following output from the configure command:
Output*** Configuration summary for nagios 4.3.4 2017-08-24 ***:

 General Options:
 -------------------------
        Nagios executable:  nagios
        Nagios user/group:  nagios,nagios
       Command user/group:  nagios,nagcmd
             Event Broker:  yes
        Install ${prefix}:  /usr/local/nagios
    Install ${includedir}:  /usr/local/nagios/include/nagios
                Lock file:  /run/nagios.lock
   Check result directory:  ${prefix}/var/spool/checkresults
           Init directory:  /etc/init.d
  Apache conf.d directory:  /etc/apache2/sites-available
             Mail program:  /bin/mail
                  Host OS:  linux-gnu
          IOBroker Method:  epoll

 Web Interface Options:
 ------------------------
                 HTML URL:  http://localhost/nagios/
                  CGI URL:  http://localhost/nagios/cgi-bin/
 Traceroute (used by WAP):


Review the options above for accuracy.  If they look okay,
type 'make all' to compile the main program and CGIs.
Now compile Nagios with this command:
- make all
Now run these make commands to install Nagios, its init scripts, and its default configuration files:
- sudo make install
- sudo make install-commandmode
- sudo make install-init
- sudo make install-config
You’ll use Apache to serve Nagios’ web interface, so copy the sample Apache configuration file to the /etc/apache2/sites-available folder:
- sudo /usr/bin/install -c -m 644 sample-config/httpd.conf /etc/apache2/sites-available/nagios.conf
In order to issue external commands via the web interface to Nagios, add the web server user, www-data, to the nagcmd group:
- sudo usermod -G nagcmd www-data
Nagios is now installed. Let’s install a plugin which will allow Nagios to collect data from various hosts.
Step 2 — Installing the check_nrpe Plugin
Nagios monitors remote hosts using the Nagios Remote Plugin Executor, or NRPE. It consists of two pieces:
- The
check_nrpeplugin which is used by Nagios server. - The NRPE daemon, which runs on the remote hosts and sends data to the Nagios server.
Let’s install the check_nrpe plugin on our Nagios server.
Find the download URL for the latest stable release of NRPE at the Nagios Exchange site.
Download it to your home directory with curl:
- cd ~
- curl -L -O https://github.com/NagiosEnterprises/nrpe/releases/download/nrpe-3.2.1/nrpe-3.2.1.tar.gz
Extract the NRPE archive:
- tar zxf nrpe-*.tar.gz
Then change to the extracted directory:
- cd nrpe-*
Configure the check_nrpe plugin:
- ./configure
Now build and install check_nrpe:
- make check_nrpe
- sudo make install-plugin
Let’s configure the Nagios server next.
Step 3 — Configuring Nagios
Now let’s perform the initial Nagios configuration, which involves editing some configuration files and configuring Apache to serve the Nagios web interface. You only need to perform this section once on your Nagios server.
Open the main Nagios configuration file in your text editor:
- sudo nano /usr/local/nagios/etc/nagios.cfg
Find this line in the file:
...
#cfg_dir=/usr/local/nagios/etc/servers
...
Uncomment this line by deleting the # character from the front of the line:
cfg_dir=/usr/local/nagios/etc/servers
Save the file and exit the editor.
Now create the directory that will store the configuration file for each server that you will monitor:
- sudo mkdir /usr/local/nagios/etc/servers
Open the Nagios contacts configuration in your text editor:
- sudo nano /usr/local/nagios/etc/objects/contacts.cfg
Find the email directive and replace its value with your own email address:
...
define contact{
        contact_name                    nagiosadmin             ; Short name of user
        use                             generic-contact         ; Inherit default values from generic-contact template (defined above)
        alias                           Nagios Admin            ; Full name of user
        email                           your_email@your_domain.com        ; <<***** CHANGE THIS TO YOUR EMAIL ADDRESS ******
...
Save and exit the editor.
Next, add a new command to your Nagios configuration that lets you use the check_nrpe command in Nagios service definitions. Open the file /usr/local/nagios/etc/objects/commands.cfg in your editor:
- sudo nano /usr/local/nagios/etc/objects/commands.cfg
Add the following to the end of the file to define a new command called check_nrpe:
...
define command{
        command_name check_nrpe
        command_line $USER1$/check_nrpe -H $HOSTADDRESS$ -c $ARG1$
}
This defines the name and specifies the command-line options to execute the plugin. You’ll use this command in Step 5.
Save and exit the editor.
Now configure Apache to serve the Nagios user interface. Enable the Apache rewrite and cgi modules with the a2enmod command:
- sudo a2enmod rewrite
- sudo a2enmod cgi
Use the htpasswd command to create an admin user called nagiosadmin that can access the Nagios web interface:
sudo htpasswd -c /usr/local/nagios/etc/htpasswd.users nagiosadmin
Enter a password at the prompt. Remember this password, as you will need it to access the Nagios web interface.
Note: If you create a user with a name other than nagiosadmin, you will need to edit /usr/local/nagios/etc/cgi.cfg and change all the nagiosadmin references to the user you created.
Now create a symbolic link for nagios.conf to the sites-enabled directory. This enables the Nagios virtual host.
- sudo ln -s /etc/apache2/sites-available/nagios.conf /etc/apache2/sites-enabled/
Next, open the Apache configuration file for Nagios.
- sudo nano /etc/apache2/sites-available/nagios.conf
If you’ve configured Apache to serve pages over HTTPS, locate both occurrences of this line:
# SSLRequireSSL
Uncomment both occurrances by removing the # symbol.
If you want to restrict the IP addresses that can access the Nagios web interface so that only certain IP addresses can access the interface, find the following two lines:
Order allow,deny
Allow from all
Comment them out by adding # symbols in front of them:
# Order allow,deny
# Allow from all
Then find the following lines:
#  Order deny,allow
#  Deny from all
#  Allow from 127.0.0.1
Uncomment them by deleting the # symbols, and add the IP addresses or ranges (space delimited) that you want to allow to in the Allow from line:
Order deny,allow
Deny from all
Allow from 127.0.0.1 your_ip_address
These lines appear twice in the configuration file, so ensure you change both occurrences. Then save and exit the editor.
Restart Apache to load the new Apache configuration:
- sudo systemctl restart apache2
With the Apache configuration in place, you can set up the service for Nagios. Nagios does not provide a Systemd unit file to manage the service, so let’s create one. Create the nagios.service file and open it in your editor:
- sudo nano /etc/systemd/system/nagios.service
Enter the following definition into the file. This definition specifies when Nagios should start and where Systemd can find the Nagios application. Learn more about Systemd unit files in the tutorial Understanding Systemd Units and Unit Files
[Unit]
Description=Nagios
BindTo=network.target

[Install]
WantedBy=multi-user.target

[Service]
Type=simple
User=nagios
Group=nagios
ExecStart=/usr/local/nagios/bin/nagios /usr/local/nagios/etc/nagios.cfg
Save the file and exit your editor.
Then start Nagios and enable it to start when the server boots:
- sudo systemctl enable /etc/systemd/system/nagios.service
- sudo systemctl start nagios
Nagios is now running, so let’s log in to its web interface.
Step 4 — Accessing the Nagios Web Interface
Open your favorite web browser, and go to your Nagios server by visiting http://nagios_server_public_ip/nagios.
Enter the login credentials for the web interface in the popup that appears. Use nagiosadmin for the username, and the password you created for that user.
After authenticating, you will see the default Nagios home page. Click on the Hosts link in the left navigation bar to see which hosts Nagios is monitoring:
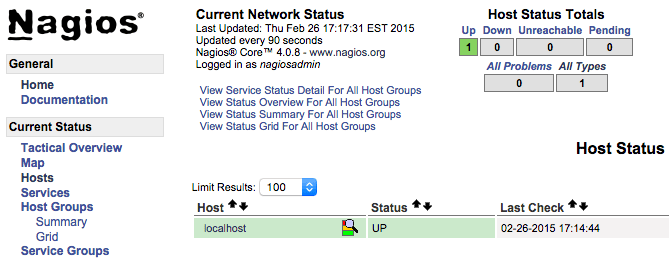
As you can see, Nagios is monitoring only “localhost”, or itself.
Let’s monitor our other server with Nagios,
Step 5 — Installing NPRE on a Host
Let’s add a new host so Nagios can monitor it. We’ll install the Nagios Remote Plugin Executor (NRPE) on the remote host, install some plugins, and then configure the Nagios server to monitor this host.
Log in to the second server, which we’ll call the monitored server.
- ssh sammy@your_monitored_server_ip
First create create a “nagios” user which will run the NRPE agent.
- sudo useradd nagios
We’ll install NRPE from source, which means you’ll need the same development libraries you installed on the Nagios server in Step 1. Update your package sources and install the NRPE prerequisites:
- sudo apt-get update
- sudo apt-get install build-essential libgd2-xpm-dev openssl libssl-dev unzip
NRPE requires that Nagios plugins is installed on the remote host. Let’s install this package from source.
Find the latest release of Nagios Plugins from the Nagios Plugins Download page. Copy the link address for the latest version, and copy the link address so you can download it to your Nagios server.
Download Nagios Plugins to your home directory with curl:
- cd ~
- curl -L -O http://nagios-plugins.org/download/nagios-plugins-2.2.1.tar.gz
Extract the Nagios Plugins archive:
- tar zxf nagios-plugins-*.tar.gz
Change to the extracted directory:
- cd nagios-plugins-*
Before building Nagios Plugins, configure it to use the nagios user and group, and configure OpenSSL support:
- ./configure --with-nagios-user=nagios --with-nagios-group=nagios --with-openssl
Now compile the plugins:
- make
Then install them:
- sudo make install
Next, install NRPE. Find the download URL for the latest stable release of NRPE at the Nagios Exchange site just like you did in Step 1. Download the latest stable release of NRPE to your monitored server’s home directory with curl:
- cd ~
- curl -L -O https://github.com/NagiosEnterprises/nrpe/releases/download/nrpe-3.2.1/nrpe-3.2.1.tar.gz
Extract the NRPE archive with this command:
- tar zxf nrpe-*.tar.gz
Then change to the extracted directory:
- cd nrpe-*
Configure NRPE by specifying the Nagios user and group, and tell it you want SSL support:
- ./configure --enable-command-args --with-nagios-user=nagios --with-nagios-group=nagios --with-ssl=/usr/bin/openssl --with-ssl-lib=/usr/lib/x86_64-linux-gnu
Now build and install NRPE and its startup script with these commands:
- make all
- sudo make install
- sudo make install-config
- sudo make install-init
Next, let’s update the NRPE configuration file:
- sudo nano /usr/local/nagios/etc/nrpe.cfg
Find the allowed_hosts directive, and add the private IP address of your Nagios server to the comma-delimited list:
- allowed_hosts=127.0.0.1,::1,your_nagios_server_private_ip
This configures NRPE to accept requests from your Nagios server via its private IP address.
Save and exit your editor. Now you can start NRPE:
- sudo systemctl start nrpe.service
Ensure that the service is running by checking its status:
- sudo systemctl status nrpe.service
You’ll see the following output:
Output...
Oct 16 07:10:00 nagios systemd[1]: Started Nagios Remote Plugin Executor.
Oct 16 07:10:00 nagios nrpe[14653]: Starting up daemon
Oct 16 07:10:00 nagios nrpe[14653]: Server listening on 0.0.0.0 port 5666.
Oct 16 07:10:00 nagios nrpe[14653]: Server listening on :: port 5666.
Oct 16 07:10:00 nagios nrpe[14653]: Listening for connections on port 5666
Oct 16 07:10:00 nagios nrpe[14653]: Allowing connections from: 127.0.0.1,::1,207.154.249.232
Next, allow access to port 5666 through the firewall. If you are using UFW, configure it to allow TCP connections to port 5666:
- sudo ufw allow 5666/tcp
You can learn more about UFW in How To Set Up a Firewall with UFW on Ubuntu 16.04.
Now you can check the communication with the remote NRPE server. Run the following command on the Nagios server:
- /usr/local/nagios/libexec/check_nrpe -H remote_host_ip
You’ll see the following output:
OutputNRPE v3.2.1
Now let’s configure some basic checks that Nagios can monitor.
First, let’s monitor the disk usage of this server. Use the df -h command to look for the root filesystem. You’ll use this filesystem name in the NRPE configuration:
- df -h /
You’ll see output similar to this:
OutputFilesystem      Size  Used Avail Use% Mounted on
udev            490M     0  490M   0% /dev
tmpfs           100M  3.1M   97M   4% /run
/dev/vda1        29G  1.4G   28G   5% /
tmpfs           497M     0  497M   0% /dev/shm
tmpfs           5.0M     0  5.0M   0% /run/lock
tmpfs           497M     0  497M   0% /sys/fs/cgroup
/dev/vda15      105M  3.4M  102M   4% /boot/efi
tmpfs           100M     0  100M   0% /run/user/0
Locate the filesystem associated with /. On a Droplet, the filesystem you want is probably /dev/vda1.
Now open /usr/local/nagios/etc/nrpe.cfg file in your editor:
- sudo nano /usr/local/nagios/etc/nrpe.cfg
The NRPE configuration file is very long and full of comments. There are a few lines that you will need to find and modify:
- server_address: Set to the private IP address of the monitored server
- command[check_hda1]: Change
/dev/hda1to whatever your root filesystem is called
Locate these settings and alter them appropriately:
...
server_address=monitored_server_private_ip
...
command[check_vda1]=/usr/lib/nagios/plugins/check_disk -w 20% -c 10% -p /dev/vda1
...
Save and exit the editor.
Restart the NRPE service to put the change into effect:
- sudo systemctl restart nrpe.service
Repeat the steps in this section for each additional server you want to monitor.
Once you are done installing and configuring NRPE on the hosts that you want to monitor, you will have to add these hosts to your Nagios server configuration before it will start monitoring them. Let’s do that next.
Step 6 – Monitoring Hosts with Nagios
To monitor your hosts with Nagios, you’ll add configuration files for each host specifying what you want to monitor. You can then view those hosts in the Nagios web interface.
On your Nagios server, create a new configuration file for each of the remote hosts that you want to monitor in /usr/local/nagios/etc/servers/. Replace the highlighted word, monitored_server_host_name with the name of your host:
- sudo nano /usr/local/nagios/etc/servers/your_monitored_server_host_name.cfg
Add the following host definition, replacing the host_name value with your remote hostname, the alias value with a description of the host, and the address value with the private IP address of the remote host:
define host {
        use                             linux-server
        host_name                       your_monitored_server_host_name
        alias                           My client server
        address                         your_monitored_server_private_ip
        max_check_attempts              5
        check_period                    24x7
        notification_interval           30
        notification_period             24x7
}
With this configuration, Nagios will only tell you if the host is up or down. Let’s add some services to monitor.
First, add this block to monitor CPU usage:
define service {
        use                             generic-service
        host_name                       your_monitored_server_host_name
        service_description             CPU load
        check_command                   check_nrpe!check_load
}
The use generic-service directive tells Nagios to inherit the values of a service template called generic-service which is predefined by Nagios.
Next, add this block to monitor disk usage:
define service {
        use                             generic-service
        host_name                       your_monitored_server_host_name
        service_description             /dev/vda1 free space
        check_command                   check_nrpe!check_vda1
}
Now save and quit. Restart the Nagios service to put any changes into effect:
- sudo systemctl restart nagios
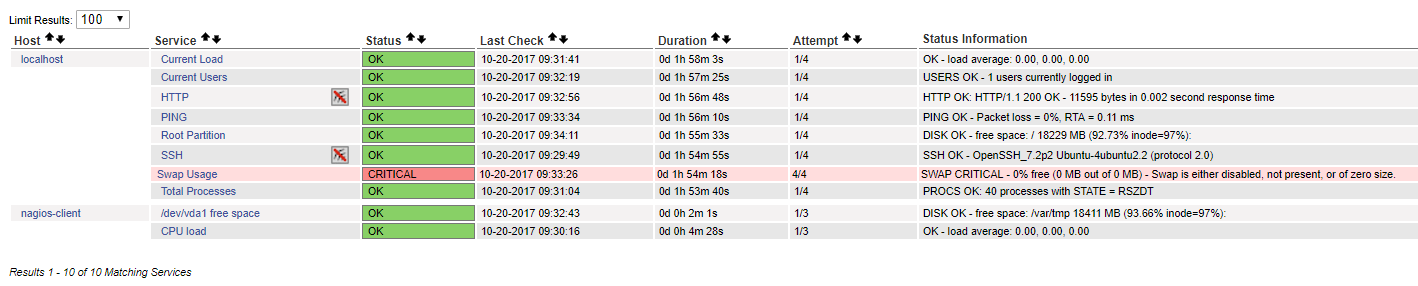
After several minutes, Nagios will check the new hosts and you’ll see them in the Nagios web interface. Click on the Services link in the left navigation bar to see all of your monitored hosts and services.
Conclusion
You’ve installed Nagios on a server and configured it to monitor CPU and disk usage of at least one remote machine.
Now that you’re monitoring a host and some of its services, you can start using Nagios to monitor your mission-critical services. You can use Nagios to set up notifications for critical events. For example, you can receive an email when your disk utilization reaches a warning or critical threshold, or a notification when your main website is down. This way you can resolve the situation promptly, or even before a problem even occurs.
Thanks for learning with the DigitalOcean Community. Check out our offerings for compute, storage, networking, and managed databases.
About the author(s)
Monitoring engineer
Managed the Write for DOnations program, wrote and edited community articles, and makes things on the Internet. Expertise in DevOps areas including Linux, Ubuntu, Debian, and more.
Still looking for an answer?
This textbox defaults to using Markdown to format your answer.
You can type !ref in this text area to quickly search our full set of tutorials, documentation & marketplace offerings and insert the link!
I get this error in the web page Error: Could not read object configuration data!
and in console gilmata@ServI:$ service nagios start Starting nagios:Contraseña: su: Fallo de autenticación ERROR: Could not create or update ‘/usr/local/nagios/var/nagios.configtest’
Hi, Thank you for the very good article !! I just wanted to add that the installation of the Nagios tools is missing:
In short the missing commands: cd ~ wget https://nagios-plugins.org/download/nagios-plugins-2.2.1.tar.gz tar -xzf nagios-plugins*.tar.gz cd nagios-plugins-2.2.1/
./configure --with-nagios-user=nagios --with-nagios-group=nagios make make install
Thanks and best regards Manfred
Thank you so much for writing these things in a very clear manner. we found this site very useful for all our searches :)
Hello go followed the guide without having any mistake. I can run from the terminal to start the nagios service without problems, but when I access nagios through we the system says “nagios not found”. I also opened port 80 for the ip address of the server on my router. what is the problem?. server apache2 is ready. if i do access ti my addres ip with web browser it is ready
I am stuck on the end of Step 3. I have made it through all steps until this without problems. When I try to enable the service:
sudo systemctl enable /etc/systemd/system/nagios.service
I get this error:
Failed to execute operation: File exists
I am still able to start the Nagios, however I just get a blank white screen after authentication.
Any ideas?
Thank you so much for this tutorial! I have 1 question about when you install the check_nrpe plugin… I need to modify the check_nrpe.cfg because a couple of my servers on my network are old and in order for it to work I need to modify the check_nrpe command to use -n. I can’t find this file so I am wondering how to go about this.
To be specific: my issue is in my
define service{ check_nrpe!something }
I would need check_nrpe to use the -n… since to get it to work I need to do the commands like this from the nagios server:
/usr/local/nagios$ libexec/check_nrpe -H 192.168.0.21 -n -c check_mem
How do I go about that? :)
Thanks!
I have completed the steps upto Step-3. When accessing the Nagios web interface in step-4, I am getting blank screen after putting user name and password. What is breaking in the configuration?
Thanks
Apache is not starting after changes on sites enabled, ScriptAlias /nagios/cgi-bin “/usr/local/nagios/sbin”
<Directory “/usr/local/nagios/sbin”> SSLRequireSSL Options ExecCGI AllowOverride None <IfVersion >= 2.3> <RequireAll> Require all granted
Require host 127.0.0.1
     AuthName "Nagios Access"
     AuthType Basic
     AuthUserFile /usr/local/nagios/etc/htpasswd.users
     Require valid-user
  </RequireAll>
</IfVersion> <IfVersion < 2.3>
Order allow,deny
Allow from all
 Order deny,allow
 Deny from all
 Allow from 127.0.0.1 192.168.1.6

  AuthName "Nagios Access"
  AuthType Basic
  AuthUserFile /usr/local/nagios/etc/htpasswd.users
  Require valid-user
</IfVersion> </Directory>
Alias /nagios “/usr/local/nagios/share”
<Directory “/usr/local/nagios/share”> SSLRequireSSL Options None AllowOverride None <IfVersion >= 2.3> <RequireAll> Require all granted Require all granted
Require host 127.0.0.1
     AuthName "Nagios Access"
     AuthType Basic
     AuthUserFile /usr/local/nagios/etc/htpasswd.users
     Require valid-user
  </RequireAll>
</IfVersion> <IfVersion < 2.3>
Order allow,deny
Allow from all
 Order deny,allow
 Deny from all
 Allow from 127.0.0.1 192.168.1.6

  AuthName "Nagios Access"
  AuthType Basic
  AuthUserFile /usr/local/nagios/etc/htpasswd.users
  Require valid-user
</IfVersion> </Directory>
Remote Client: Showing host is not allowed
ubuntu@ip-172-31-1-238:/usr/local/nagios/libexec$ sudo systemctl status nrpe
● nrpe.service - Nagios Remote Plugin Executor
   Loaded: loaded (/lib/systemd/system/nrpe.service; enabled; vendor preset: enabled)
   Active: active (running) since Mon 2019-08-05 07:26:13 UTC; 36min ago
     Docs: http://www.nagios.org/documentation
  Process: 15332 ExecStopPost=/bin/rm -f /usr/local/nagios/var/nrpe.pid (code=exited, status=0/SUCCESS)
 Main PID: 15336 (nrpe)
    Tasks: 1
   Memory: 808.0K
      CPU: 11ms
   CGroup: /system.slice/nrpe.service
           └─15336 /usr/local/nagios/bin/nrpe -c /usr/local/nagios/etc/nrpe.cfg -f

Aug 05 07:26:13 ip-172-31-1-238 nrpe[15336]: Server listening on 0.0.0.0 port 5666.
Aug 05 07:26:13 ip-172-31-1-238 nrpe[15336]: Server listening on :: port 5666.
Aug 05 07:26:13 ip-172-31-1-238 nrpe[15336]: Listening for connections on port 5666
Aug 05 07:26:13 ip-172-31-1-238 nrpe[15336]: Allowing connections from: 172.31.8.319,127.0.0.1,::1
Aug 05 07:26:36 ip-172-31-1-238 nrpe[15508]: Host 172.31.8.139 is not allowed to talk to us!
Aug 05 07:26:42 ip-172-31-1-238 nrpe[15562]: Host 172.31.8.139 is not allowed to talk to us!
Aug 05 07:45:23 ip-172-31-1-238 systemd[1]: Started Nagios Remote Plugin Executor.
Aug 05 07:45:37 ip-172-31-1-238 nrpe[22799]: Host 172.31.8.139 is not allowed to talk to us!
Aug 05 07:46:22 ip-172-31-1-238 nrpe[23111]: Host 172.31.8.139 is not allowed to talk to us!
Aug 05 08:02:11 ip-172-31-1-238 nrpe[29244]: Host 172.31.8.139 is not allowed to talk to us!
 This work is licensed under a Creative Commons Attribution-NonCommercial- ShareAlike 4.0 International License.
Become a contributor for community
Get paid to write technical tutorials and select a tech-focused charity to receive a matching donation.

DigitalOcean Documentation
Full documentation for every DigitalOcean product.

Resources for startups and AI-native businesses
The Wave has everything you need to know about building a business, from raising funding to marketing your product.
The developer cloud
Scale up as you grow — whether you're running one virtual machine or ten thousand.

Start building today
From GPU-powered inference and Kubernetes to managed databases and storage, get everything you need to build, scale, and deploy intelligent applications.
