By Akshit Pratiush and Easha Abid

Introduction
OpenSearch is designed to offer highly scalable and flexible search capabilities for a wide range of applications. It supports full-text search, log analytics, and real-time monitoring, providing powerful tools for data exploration and visualization. OpenSearch’s efficient log management is crucial for troubleshooting and monitoring applications.
DigitalOcean App Platform supports OpenSearch log forwarding. You can forward runtime logs from your App Platform apps to an OpenSearch cluster, where you can analyze and query your app’s logs using OpenSearch’s APIs and dashboards.
This approach comes in handy if you want to:
- Monitor and Troubleshoot: Track application performance and errors by analyzing real-time logs.
- Analyze Performance: Gain insights into web traffic patterns and server metrics.
- Centralized Logging: Aggregate logs from multiple applications hosted on App Platform into a single OpenSearch instance for easier management.
In this tutorial, you will learn how to configure your App Platform application to sed logs to a DigitalOcean managed OpenSearch dashboard.
Prerequisites
Before you begin, ensure you have the following:
- A valid DigitalOcean account. For a detailed walkthrough, refer to the Getting Started with DigitalOcean documentation.
- A Managed OpenSearch Cluster.
- An application running on DigitalOcean App Platform. Learn how to crate apps on App Platform by following DigitalOcean’s official docs.
Step 1 - Creating Managed OpenSearch DB
To create a managed OpenSearch database, go to the database section of the control panel and click on Create Database.
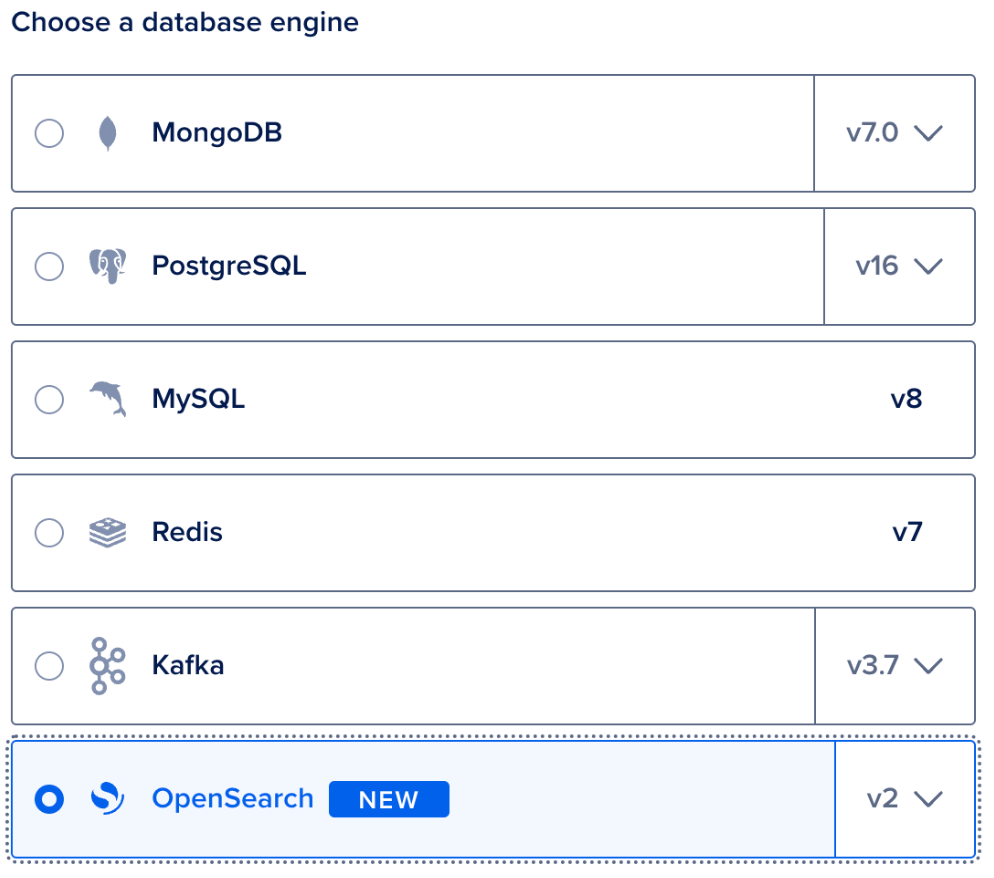
Choose a datacenter/region. Select the desired VPC network from the region (if you have multiple VPCs created). Choose OpenSearch as Database engine.
Now, Choose the configuration for the database.
You will be able to change the configuration and upscale at any time after the cluster creation, however downscaling is currently not supported.
OpenSearch also supports scale storage, hence you can choose the storage size.
Finally, give the database cluster Name, select your preferred Project, and add tags (if any).
Click on create Database Cluster when done.
Step 2 - Configuring the Application
You can forward logs to your Managed OpenSearch cluster to view them in the OpenSearch Dashboard in the control panel.
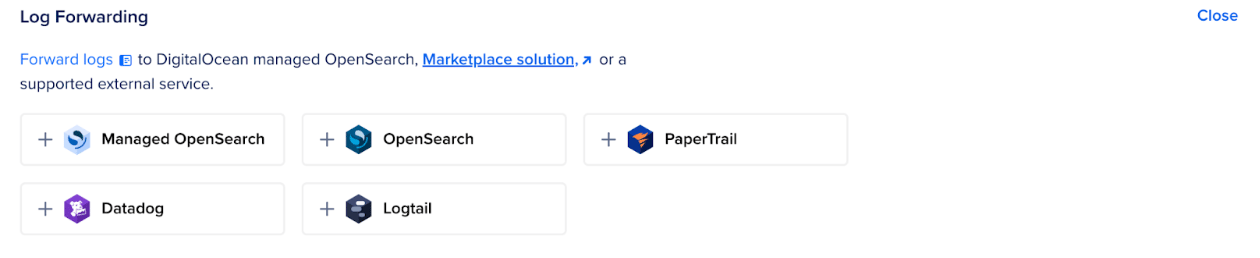
To configure log forwarding, go to the Apps section of the control panel, click on your app, and click on the Settings tab. In the Log Forwarding section, click Edit and select Managed OpenSearch.
Then, provide the applicable values:
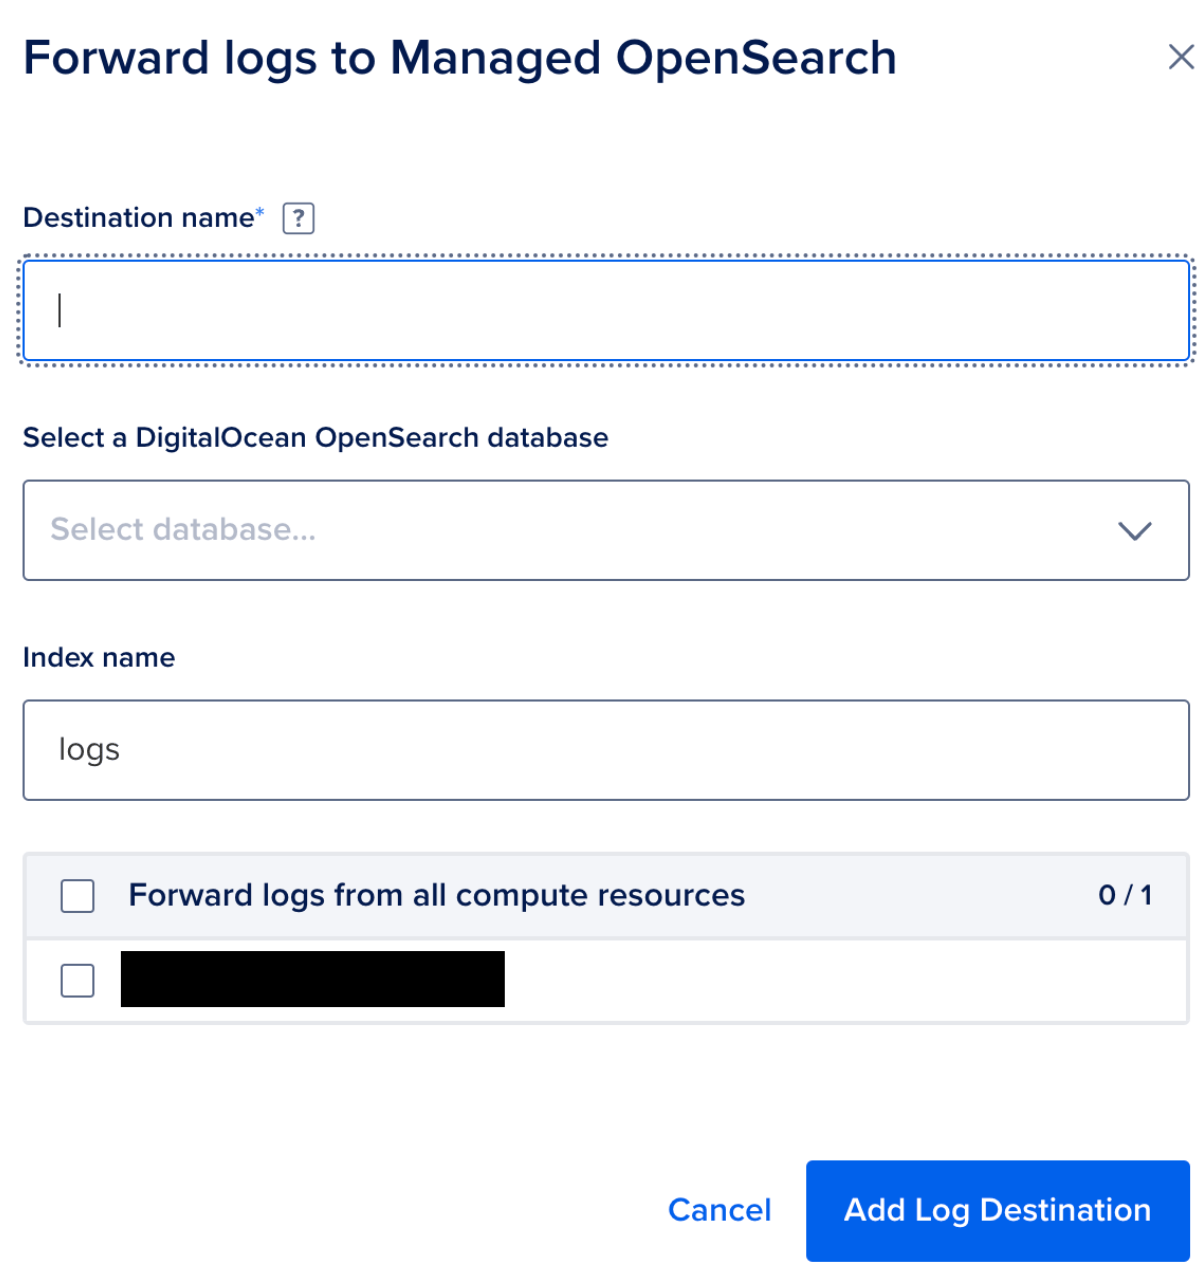
Define the Destination name that will help you differentiate multiple log integrations.
Select the DigitalOcean OpenSearch database. When you click, you will see a dropdown list of available Managed OpenSearch clusters in your account. Select the one appropriate for your use.
An Index name refers to the unique identifier for an index. Each index can store and organize log data, making it easier to search, analyze, and visualize specific sets of logs based on the defined naming convention. This index name allows users to manage and query logs efficiently within the OpenSearch suite.
Now, select the resource service from the App for which you want to forward logs. Click on Add Log Destination to save this configuration.
Step 3 - Set Up OpenSearch Dashboard
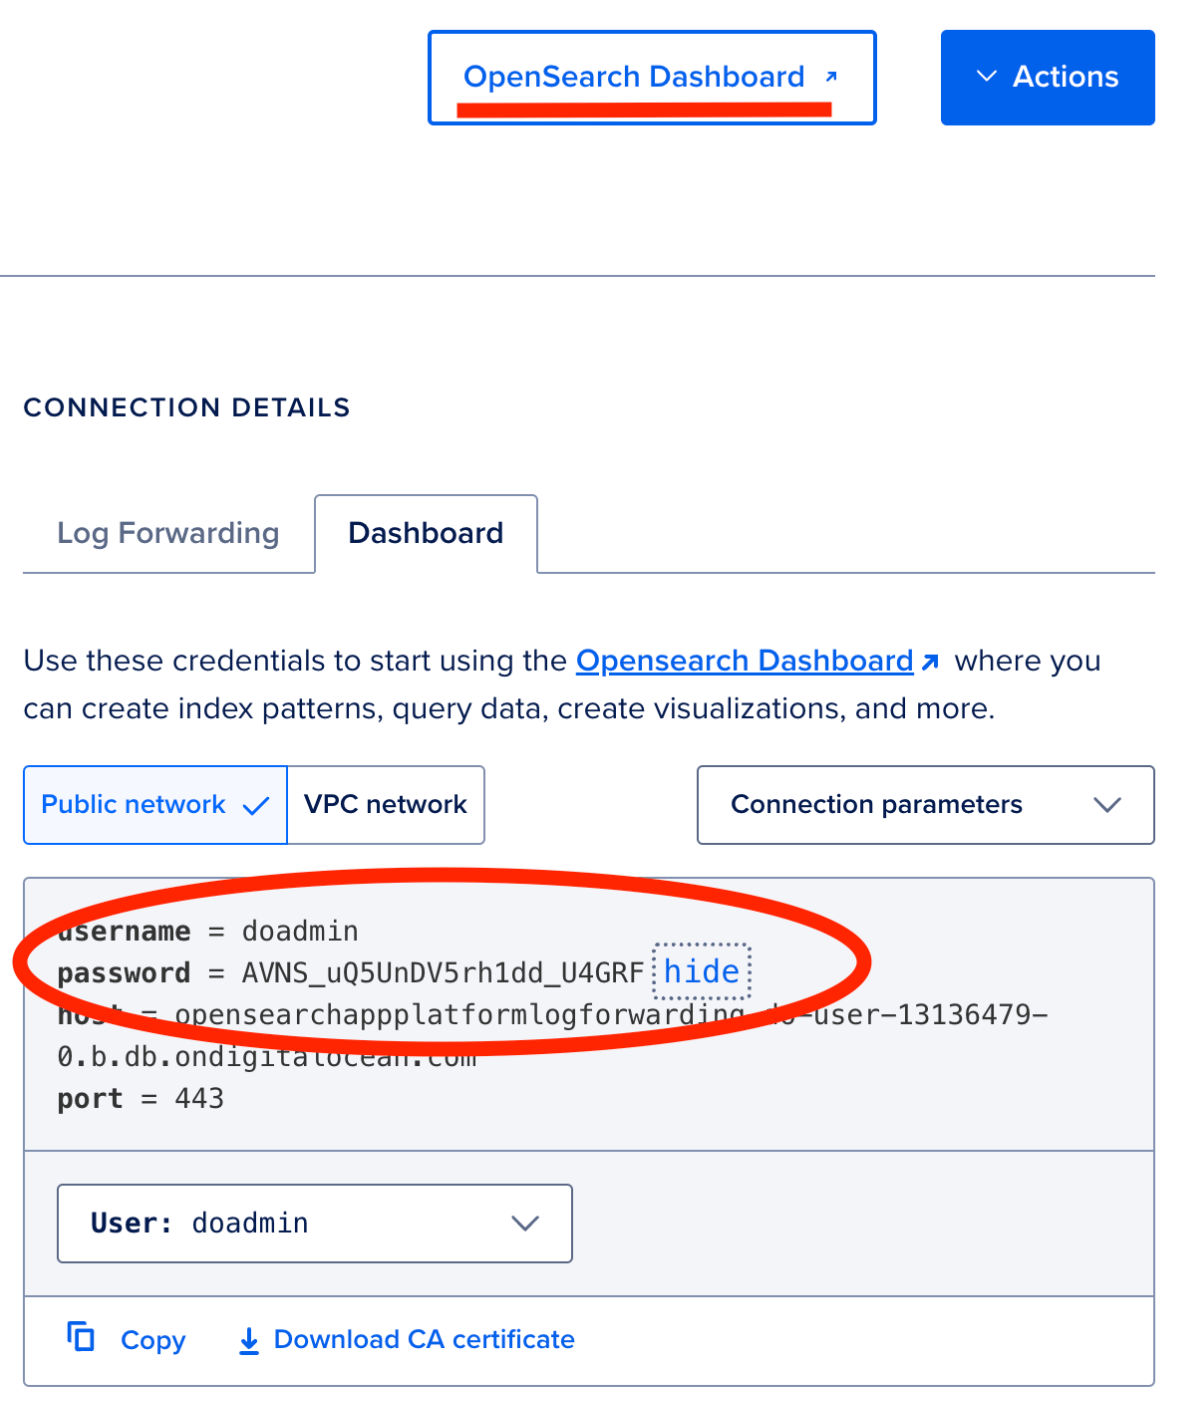
On the console, from the OpenSearch Database page, click on OpenSearch Dashboard (available on top right corner).
Trusted sources for Log forwarding to OpenSearch DBaaS are not supported. Adding Trusted sources might fail to load the dashboard.
Dashboard will ask for login credentials. Your login credentials are available in the Connection Details section.
Once logged into the dashboard, from the top left menu, scroll to Management -> Dashboard Management.
Here, select Index patterns. Index patterns help retrieve your data from OpenSearch.
- Select the Data source.
- Here you should see the Index name you defined while configuring forward logging on your app through App Platform.
- Time Field Name indices contain a timestamp field (common in log data). You will need to select the field to use for time-based queries and visualizations.
- Click Create index pattern to complete the setup.
From the Menu -> OpenSearch Dashboards -> Discover, you should be able to see the logs under the Index name you defined earlier. If there are multiple indexes, you can choose the appropriate one from the dropdown.
Conclusion
You’ve successfully configured your App Platform service to collect and forward logs to a DigitalOcean Managed OpenSearch database. You have also learned how to create a new dashboard, add visualizations, and customize your OpenSearch Dashboards. With these skills, you can now monitor and analyze your web server logs effectively.
Thanks for learning with the DigitalOcean Community. Check out our offerings for compute, storage, networking, and managed databases.
About the author(s)
I work closely with startups, developers and enterprise customers to design and scale cost efficient cloud and AI applications. Passionate about simplifying AI, cloud, and real world architecture into practical, production ready solutions.
Still looking for an answer?
This textbox defaults to using Markdown to format your answer.
You can type !ref in this text area to quickly search our full set of tutorials, documentation & marketplace offerings and insert the link!
How to extract data from key “log” while it compile as text. can we convert as object and map them as field ? Here Log that we got from App Platform into opensearch
{
  "_index": "xxxxx",
  "_id": "qIa-xJIBLP38T2M0QfyV",
  "_version": 1,
  "_score": null,
  "_source": {
    "@timestamp": "2024-10-25T17:34:15.309Z",
    "log": "\u001b[32mINFO\u001b[39m [2024-10-25 17:34:14.595 +0000] (12): \u001b[90m{\"req\":{\"id\":26,\"method\":\"GET\",\"url\":\"/api/v1/employees?page=1&limit=10\",\"query\":{\"page\":\"1\",\"limit\":\"10\"},\"params\":{\"0\":\"employees\"},",
    "do_app_name": "xxxxx",
    "do_component_name": "xxxx"
  },
  "fields": {
    "@timestamp": [
      "2024-10-25T17:34:15.309Z"
    ]
  },
  "sort": [
    1729877655309
  ]
}
 This work is licensed under a Creative Commons Attribution-NonCommercial- ShareAlike 4.0 International License.
Become a contributor for community
Get paid to write technical tutorials and select a tech-focused charity to receive a matching donation.

DigitalOcean Documentation
Full documentation for every DigitalOcean product.

Resources for startups and AI-native businesses
The Wave has everything you need to know about building a business, from raising funding to marketing your product.
The developer cloud
Scale up as you grow — whether you're running one virtual machine or ten thousand.

Start building today
From GPU-powered inference and Kubernetes to managed databases and storage, get everything you need to build, scale, and deploy intelligent applications.
